
Everbridge, Inc. (EVBG): Price and Financial Metrics
EVBG Price/Volume Stats
| Current price | $35.00 | 52-week high | $36.31 |
| Prev. close | $34.99 | 52-week low | $18.50 |
| Day low | $34.99 | Volume | 2,364,100 |
| Day high | $35.01 | Avg. volume | 969,549 |
| 50-day MA | $34.78 | Dividend yield | N/A |
| 200-day MA | $27.90 | Market Cap | 1.46B |
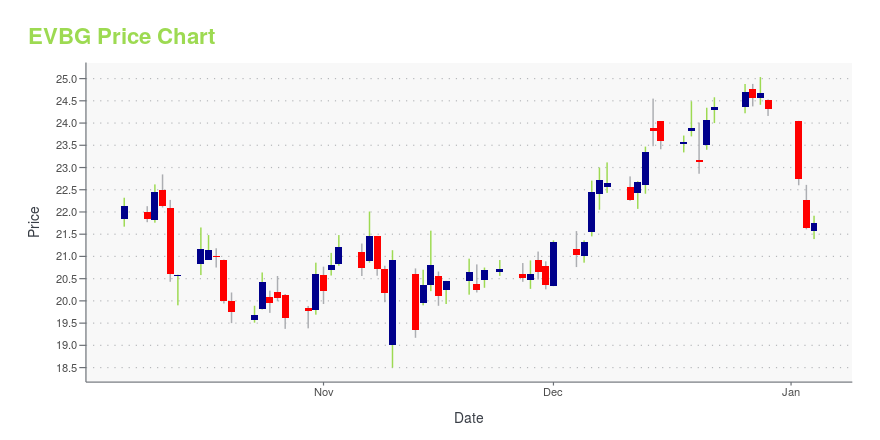
EVBG Stock Price Chart Interactive Chart >
Everbridge, Inc. (EVBG) Company Bio
Everbridge, Inc., a software company, provides critical communications and enterprise safety applications that enable customers to automate and accelerate the process of keeping people safe and businesses running during critical events. Its SaaS-based platform enables its customers to deliver messaging to a large group of people during critical situations. The company was founded in 2002 and is based in Burlington, Massachusetts.
Latest EVBG News From Around the Web
Below are the latest news stories about EVERBRIDGE INC that investors may wish to consider to help them evaluate EVBG as an investment opportunity.
Canaccord Says These 3 Communications Software Stocks Are Down but Not Out, Forecasting up to 160% Upside2023 will go down as a vintage year for the stock market but not all have enjoyed the spoils. For instance, it has been a difficult ride for many companies operating in the communications software space. This is acknowledged by Canaccord analyst Michael Walkley, who notes that it has been a challenging year for the majority of companies under his coverage in the communications software group. It has been particularly hard for smaller cap stocks with debt and especially net debt. But as every sav |
Everbridge Named a Leader Among Critical Event Management (CEM) Providers by Premier Technology Research and Advisory FirmBURLINGTON, Mass., December 07, 2023--Everbridge, Inc. (Nasdaq: EVBG), the global leader in critical event management (CEM) and national public warning software solutions, today announced that the company has been recognized as a leader in The Forrester Wave™: Critical Event Management Platforms, Q4 2023 report. Everbridge received the highest possible score in fifteen criteria including: vision, innovation, partner ecosystem, as well as criteria within the current offering category, including e |
U.S. Department of Defense Deploys Everbridge to Keep Attendees Safe During the 124th Army-Navy GameBURLINGTON, Mass., December 05, 2023--Everbridge, Inc. (Nasdaq: EVBG), the global leader in critical event management (CEM) and national public warning software solutions, today announced that the U.S. Department of Defense, in coordination with the FBI, Massachusetts State Police, and a dozen other collaborating agencies, will once again deploy the Joint Analytic Real-Time Virtual Information Sharing System (JARVISS), powered by Everbridge, to monitor and identify critical events that may threa |
Is Everbridge, Inc. (NASDAQ:EVBG) Potentially Undervalued?Everbridge, Inc. ( NASDAQ:EVBG ), might not be a large cap stock, but it saw a decent share price growth in the teens... |
Everbridge (EVBG) Software to Improve Public Safety in DubaiEverbridge's (EVBG) clientele expands as Dubai Civil Defense chooses its Computer Aided Dispatch platform for improving public safety. |
EVBG Price Returns
| 1-mo | 0.84% |
| 3-mo | 0.34% |
| 6-mo | 52.64% |
| 1-year | 16.86% |
| 3-year | -75.38% |
| 5-year | -65.52% |
| YTD | 43.97% |
| 2023 | -17.82% |
| 2022 | -56.07% |
| 2021 | -54.83% |
| 2020 | 90.92% |
| 2019 | 37.56% |
Continue Researching EVBG
Want to do more research on Everbridge Inc's stock and its price? Try the links below:Everbridge Inc (EVBG) Stock Price | Nasdaq
Everbridge Inc (EVBG) Stock Quote, History and News - Yahoo Finance
Everbridge Inc (EVBG) Stock Price and Basic Information | MarketWatch
Loading social stream, please wait...