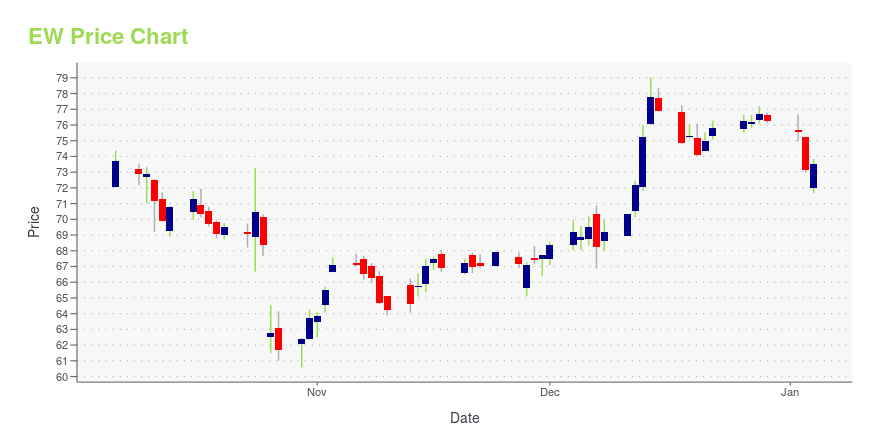
Edwards Lifesciences Corp. (EW): Price and Financial Metrics
EW Price/Volume Stats
| Current price | $62.37 | 52-week high | $96.12 |
| Prev. close | $59.70 | 52-week low | $58.93 |
| Day low | $60.28 | Volume | 14,109,849 |
| Day high | $63.80 | Avg. volume | 3,771,436 |
| 50-day MA | $88.01 | Dividend yield | N/A |
| 200-day MA | $81.53 | Market Cap | 37.58B |
EW Stock Price Chart Interactive Chart >
Edwards Lifesciences Corp. (EW) Company Bio
Edwards Lifesciences is an American medical technology company headquartered in Irvine, California, specializing in artificial heart valves and hemodynamic monitoring. It developed the SAPIEN transcatheter aortic heart valve made of cow tissue within a balloon-expandable, cobalt-chromium frame, deployed via catheter. The company has manufacturing facilities at the Irvine headquarters, as well as in Draper, Utah; Costa Rica; the Dominican Republic; Puerto Rico; and Singapore; and is building a new facility due to be completed in 2021 in Limerick, Ireland. (Source:Wikipedia)
Latest EW News From Around the Web
Below are the latest news stories about EDWARDS LIFESCIENCES CORP that investors may wish to consider to help them evaluate EW as an investment opportunity.
Fears Of Negative Clinical Trial Result Dragged Edwards Lifesciences Corporation (EW) in Q3Scout Investments, Inc, an affiliate of Carillon Tower Advisers, Inc, released the “Carillon Scout Mid Cap Fund” third quarter 2023 investor letter. A copy of the same can be downloaded here. Major equity indices began the quarter on a positive note, but as the quarter progressed, they succumbed to increased interest rates and economic concerns. Large caps […] |
ITGR or EW: Which Is the Better Value Stock Right Now?ITGR vs. EW: Which Stock Is the Better Value Option? |
Some Confidence Is Lacking In Edwards Lifesciences Corporation's (NYSE:EW) P/EWith a price-to-earnings (or "P/E") ratio of 32.6x Edwards Lifesciences Corporation ( NYSE:EW ) may be sending very... |
Edwards Lifesciences (EW) Forwards Growth Strategy and OutlookEdwards Lifesciences' (EW) TAVR remains strong, driven by greater awareness, patient activation and advances in new technologies such as RESILIA. |
Edwards to spin off its critical care businessEdwards is the latest healthcare firm to spin off a business to focus on specific markets, following larger companies like Johnson & Johnson and GE. |
EW Price Returns
| 1-mo | -31.88% |
| 3-mo | -27.84% |
| 6-mo | -14.84% |
| 1-year | -24.56% |
| 3-year | -43.25% |
| 5-year | -12.09% |
| YTD | -18.20% |
| 2023 | 2.20% |
| 2022 | -42.41% |
| 2021 | 42.00% |
| 2020 | 17.32% |
| 2019 | 52.31% |
Continue Researching EW
Here are a few links from around the web to help you further your research on Edwards Lifesciences Corp's stock as an investment opportunity:Edwards Lifesciences Corp (EW) Stock Price | Nasdaq
Edwards Lifesciences Corp (EW) Stock Quote, History and News - Yahoo Finance
Edwards Lifesciences Corp (EW) Stock Price and Basic Information | MarketWatch


Loading social stream, please wait...