
Endeavour Silver Corporation Ordinary Shares (Canada) (EXK): Price and Financial Metrics
EXK Price/Volume Stats
| Current price | $2.76 | 52-week high | $4.36 |
| Prev. close | $2.79 | 52-week low | $1.42 |
| Day low | $2.70 | Volume | 3,166,652 |
| Day high | $2.88 | Avg. volume | 5,116,060 |
| 50-day MA | $2.21 | Dividend yield | N/A |
| 200-day MA | $2.33 | Market Cap | 663.33M |
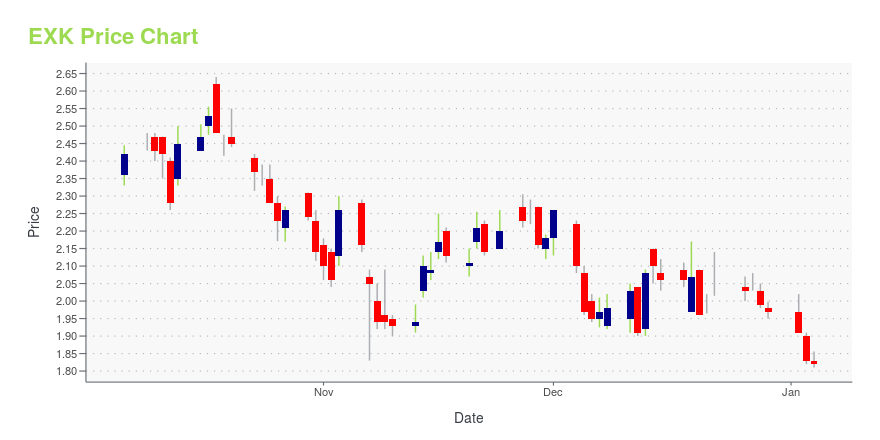
EXK Stock Price Chart Interactive Chart >
Endeavour Silver Corporation Ordinary Shares (Canada) (EXK) Company Bio
Endeavour Silver Corporation engages in the evaluation, acquisition, exploration, development, and exploitation of precious metal properties in Mexico and Chile. It produces silver-gold from its underground mines. The company was founded in 1981 and is based in Vancouver, Canada.
Latest EXK News From Around the Web
Below are the latest news stories about ENDEAVOUR SILVER CORP that investors may wish to consider to help them evaluate EXK as an investment opportunity.
Investors in Endeavour Silver (TSE:EDR) have unfortunately lost 52% over the last three yearsThe truth is that if you invest for long enough, you're going to end up with some losing stocks. But long term... |
Endeavour Silver Announces At-the-Market Offering of up to US$60 MillionVANCOUVER, British Columbia, Dec. 18, 2023 (GLOBE NEWSWIRE) -- Endeavour Silver Corp. (“Endeavour” or the “Company”) (NYSE: EXK; TSX: EDR) announces it has entered into a sales agreement dated December 18, 2023 (the “Sales Agreement”) with BMO Capital Markets Corp. (the lead agent), TD Securities (USA) LLC, CIBC World Markets Inc., Raymond James (USA) Ltd., B. Riley Securities, Inc., H.C. Wainwright & Co., LLC, A.G.P./Alliance Global Partners and Stifel Nicolaus Canada Inc. (collectively, the “A |
Endeavour Silver Announces Appointment of Chief Financial OfficerVANCOUVER, British Columbia, Dec. 05, 2023 (GLOBE NEWSWIRE) -- Endeavour Silver Corp. (“Endeavour” or the “Company”) (TSX: EDR, NYSE: EXK) is pleased to announce the appointment of Elizabeth Senez as the Company’s Chief Financial Officer (“CFO”), effective January 1, 2024. Ms. Senez brings over 20 years of extensive experience in accounting, corporate finance, and corporate treasury to her new role. Concurrent with Ms. Senez’s appointment, Christine West, the current CFO, will be transitioning t |
S&P Dow Jones Indices Announces Changes to the S&P/TSX Composite IndexAs a result of the quarterly review, S&P Dow Jones Indices will make the following changes in the S&P/TSX Composite Index prior to the open of trading on Monday, December 18, 2023: |
Endeavour Silver Hosts Investor Day and Analyst Site VisitVANCOUVER, British Columbia, Nov. 28, 2023 (GLOBE NEWSWIRE) -- Endeavour Silver Corp. (“Endeavour” or the “Company”) (TSX: EDR, NYSE: EXK) is pleased to announce the Company hosted an Investor Day at the Terronera project in Jalisco state, Mexico to showcase the project and construction progress to date. The event took place November 19-21, 2023, and brought together investors and analysts to receive an in-depth technical presentation and a guided site visit. The event provided insights into the |
EXK Price Returns
| 1-mo | 20.52% |
| 3-mo | 71.43% |
| 6-mo | 22.12% |
| 1-year | -29.41% |
| 3-year | -50.27% |
| 5-year | 22.67% |
| YTD | 40.10% |
| 2023 | -39.20% |
| 2022 | -23.22% |
| 2021 | -16.27% |
| 2020 | 109.13% |
| 2019 | 12.09% |
Continue Researching EXK
Want to see what other sources are saying about Endeavour Silver Corp's financials and stock price? Try the links below:Endeavour Silver Corp (EXK) Stock Price | Nasdaq
Endeavour Silver Corp (EXK) Stock Quote, History and News - Yahoo Finance
Endeavour Silver Corp (EXK) Stock Price and Basic Information | MarketWatch
Loading social stream, please wait...