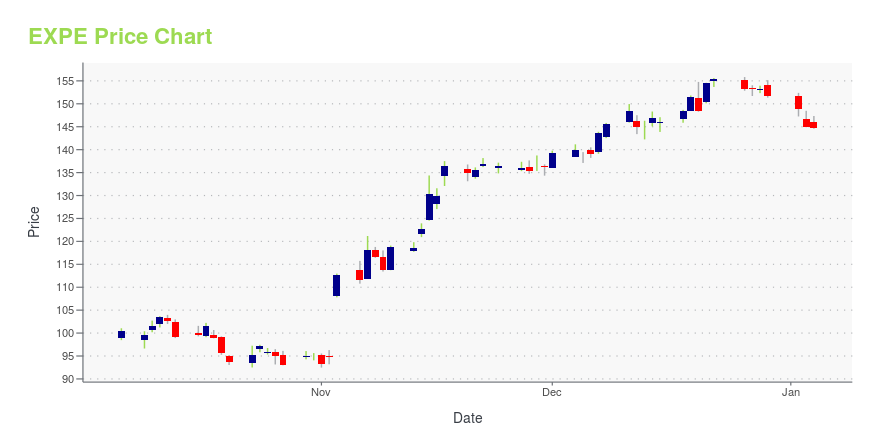
Expedia Group Inc. (EXPE): Price and Financial Metrics
EXPE Price/Volume Stats
| Current price | $125.87 | 52-week high | $160.05 |
| Prev. close | $124.90 | 52-week low | $92.48 |
| Day low | $125.19 | Volume | 1,440,147 |
| Day high | $127.19 | Avg. volume | 2,415,698 |
| 50-day MA | $122.92 | Dividend yield | N/A |
| 200-day MA | $130.07 | Market Cap | 17.15B |
EXPE Stock Price Chart Interactive Chart >
Expedia Group Inc. (EXPE) Company Bio
Expedia Group, Inc. is an American online travel shopping company for consumer and small business travel. Its websites, which are primarily travel fare aggregators and travel metasearch engines, include Expedia.com, Vrbo (previously HomeAway), Hotels.com, Hotwire.com, Orbitz, Travelocity, trivago and CarRentals.com. (Source:Wikipedia)
Latest EXPE News From Around the Web
Below are the latest news stories about EXPEDIA GROUP INC that investors may wish to consider to help them evaluate EXPE as an investment opportunity.
Travel and Leisure Titans: 3 Stocks Set to Soar in 2024These travel and leisure stocks are high-quality businesses with robust shareholder return programs that will support more gains in 2024. |
Are Retail-Wholesale Stocks Lagging Abercrombie & Fitch (ANF) This Year?Here is how Abercrombie & Fitch (ANF) and Expedia (EXPE) have performed compared to their sector so far this year. |
3 Stocks That Hedge Funds Are Abandoning in DrovesStructural shifts in the financial markets have led to interesting strategic shifts among hedge fund managers. |
Is Expedia Group (EXPE) Stock Undervalued Right Now?Here at Zacks, our focus is on the proven Zacks Rank system, which emphasizes earnings estimates and estimate revisions to find great stocks. Nevertheless, we are always paying attention to the latest value, growth, and momentum trends to underscore strong picks. |
Expedia (EXPE) Exceeds Market Returns: Some Facts to ConsiderIn the closing of the recent trading day, Expedia (EXPE) stood at $155.31, denoting a +0.51% change from the preceding trading day. |
EXPE Price Returns
| 1-mo | -1.17% |
| 3-mo | -7.24% |
| 6-mo | -17.15% |
| 1-year | 5.93% |
| 3-year | -23.12% |
| 5-year | -8.82% |
| YTD | -17.08% |
| 2023 | 73.28% |
| 2022 | -51.53% |
| 2021 | 36.50% |
| 2020 | 22.89% |
| 2019 | -2.90% |
Continue Researching EXPE
Want to do more research on Expedia Group Inc's stock and its price? Try the links below:Expedia Group Inc (EXPE) Stock Price | Nasdaq
Expedia Group Inc (EXPE) Stock Quote, History and News - Yahoo Finance
Expedia Group Inc (EXPE) Stock Price and Basic Information | MarketWatch


Loading social stream, please wait...