
Eyenovia, Inc. (EYEN): Price and Financial Metrics
EYEN Price/Volume Stats
| Current price | $1.44 | 52-week high | $2.57 |
| Prev. close | $1.44 | 52-week low | $0.50 |
| Day low | $1.41 | Volume | 1,098,400 |
| Day high | $1.56 | Avg. volume | 1,018,816 |
| 50-day MA | $0.85 | Dividend yield | N/A |
| 200-day MA | $1.27 | Market Cap | 77.57M |
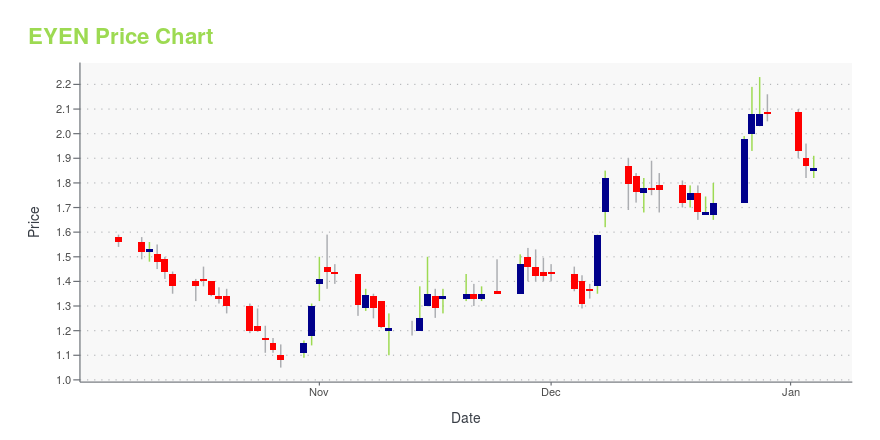
EYEN Stock Price Chart Interactive Chart >
Eyenovia, Inc. (EYEN) Company Bio
Eyenovia, Inc., a clinical stage biopharmaceutical company, engages in developing a pipeline of ophthalmology products in the United States. It is developing MicroProst that has completed Phase III clinical trials for the treatment of chronic angle closure glaucoma; MicroStat that has completed Phase II clinical trials for the treatment of mydriasis; MicroTears for the treatment of dry eye; and MicroPine for the treatment of myopia. The company was formerly known as PGP Holdings V, Inc. and changed its name to Eyenovia, Inc. in May 2014. Eyenovia, Inc. was founded in 2014 and is based in New York, New York.
Latest EYEN News From Around the Web
Below are the latest news stories about EYENOVIA INC that investors may wish to consider to help them evaluate EYEN as an investment opportunity.
7 Promising Penny Stocks With the Potential to Defy ExpectationsYou know you want it. |
Eyenovia, Inc. (NASDAQ:EYEN) Q3 2023 Earnings Call TranscriptEyenovia, Inc. (NASDAQ:EYEN) Q3 2023 Earnings Call Transcript November 13, 2023 Operator: Good day, ladies and gentlemen. And welcome to Eyenovia’s Third Quarter of 2023 Earnings Conference Call. At this time, all participants are in listen-only mode. A question-and-answer session will follow the formal presentation. As a reminder this conference is being recorded. I will […] |
Eyenovia Reports Third Quarter 2023 Financial Results and Provides Business UpdateAcquired U.S. commercial rights to APP13007, currently under FDA review for post-surgical ocular pain and inflammation, from Formosa Pharmaceuticals Announced FDA approval of Coastline International as contract manufacturer for Mydcombi cartridge subassemblies and preparations for national launch Company to host conference call and webcast today, November 13th, at 4:30 pm ET NEW YORK, Nov. 13, 2023 (GLOBE NEWSWIRE) -- Eyenovia, Inc. (NASDAQ: EYEN), a commercial-stage, topical ophthalmic company |
4 Biotech Stocks Likely to Outpace Q3 Earnings EstimatesLet us look at a few biotech companies, ACLX, LEGN, GRCL and EYEN, which are poised to beat third-quarter earnings estimates. |
Eyenovia to Report Third Quarter 2023 Results on Monday, November 13Company to host an investor conference call and webcast at 4:30pm EDTNEW YORK, Nov. 06, 2023 (GLOBE NEWSWIRE) -- Eyenovia, Inc. (NASDAQ: EYEN), an ophthalmic technology company commercializing Mydcombi™ for mydriasis, preparing for regulatory approval of APP13007 for relief of pain and inflammation post ocular surgery, and incorporating its advanced Optejet® device with late-stage product candidates for presbyopia and pediatric progressive myopia as well as out-licensing for additional indicatio |
EYEN Price Returns
| 1-mo | 108.06% |
| 3-mo | 129.23% |
| 6-mo | -27.64% |
| 1-year | -32.71% |
| 3-year | -67.05% |
| 5-year | -56.23% |
| YTD | -30.77% |
| 2023 | 27.61% |
| 2022 | -59.25% |
| 2021 | -33.99% |
| 2020 | 35.27% |
| 2019 | 57.19% |
Loading social stream, please wait...