
First American Corp. (FAF): Price and Financial Metrics
FAF Price/Volume Stats
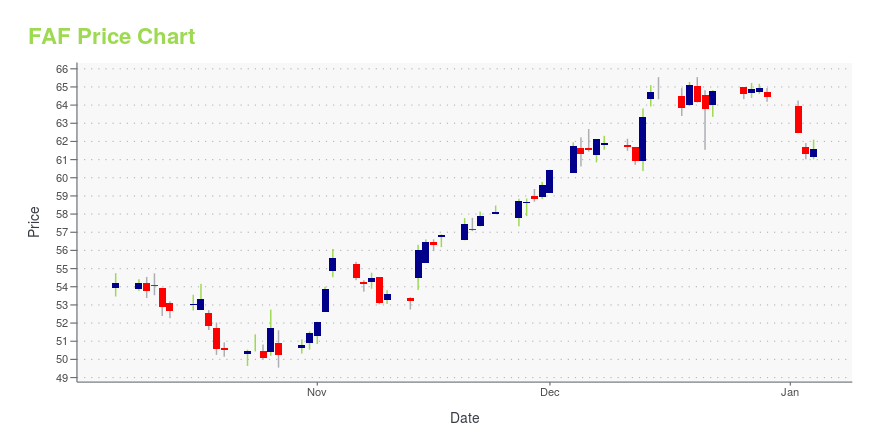
| Current price | $59.76 | 52-week high | $65.54 |
| Prev. close | $58.04 | 52-week low | $49.55 |
| Day low | $58.45 | Volume | 1,067,900 |
| Day high | $59.84 | Avg. volume | 645,070 |
| 50-day MA | $55.13 | Dividend yield | 3.64% |
| 200-day MA | $57.18 | Market Cap | 6.20B |
FAF Stock Price Chart Interactive Chart >
First American Corp. (FAF) Company Bio
First American Financial is a provider of title insurance, settlement services and risk solutions for real estate transactions. The company provides title plant management services; title and other real property records and images; valuation products and services; home warranty products; property and casualty insurance; and banking, trust and investment advisory services. The company was founded in 2008 and is based in Santa Ana, California.
Latest FAF News From Around the Web
Below are the latest news stories about FIRST AMERICAN FINANCIAL CORP that investors may wish to consider to help them evaluate FAF as an investment opportunity.
First American cybersecurity attack disrupts closings over holidaysFirst American and some of its subsidiaries remain offline as of Wednesday morning in the wake of a Dec. 20 cybersecurity incident. |
First American Financial Corporation Provides Update on Cybersecurity IncidentSANTA ANA, Calif., December 21, 2023--First American Financial Corporation (NYSE: FAF) has experienced a cybersecurity incident. In response, the company has temporarily taken certain systems offline and is working to return to normal business operations as soon as possible. Please visit FirstAmUpdate.com for the latest information. |
First American is the latest cybersecurity attack victimSources told HousingWire that First American was hacked on Wednesday afternoon, taking down some of its systems. Agents and lenders reported some delayed closings on Thursday. |
First American Financial Corporation Named Most Innovative Company of the Year, Gold Winner at Best in Biz Awards 2023SANTA ANA, Calif., December 20, 2023--First American Financial Corporation (NYSE: FAF), a premier provider of title, settlement and risk solutions for real estate transactions and the leader in the digital transformation of its industry, today announced that it was named the gold winner in the Most Innovative Company of the Year (large company) category at the Best in Biz Awards, the only independent business awards program judged each year by prominent editors and reporters from top-tier public |
Falling Mortgage Rates Spark Increase in Housing Market Potential, According to First American Data & Analytics’ Potential Home Sales ModelSANTA ANA, Calif., December 18, 2023--First American Data & Analytics, a leading national provider of property-centric information, risk management and valuation solutions and a division of First American Financial Corporation (NYSE: FAF), today released First American Data & Analytics’ proprietary Potential Home Sales Model for the month of November 2023. The Potential Home Sales Model measures what the healthy market level of home sales should be based on economic, demographic and housing mark |
FAF Price Returns
| 1-mo | 12.46% |
| 3-mo | 11.30% |
| 6-mo | 0.48% |
| 1-year | -0.57% |
| 3-year | 1.70% |
| 5-year | 22.27% |
| YTD | -5.49% |
| 2023 | 27.66% |
| 2022 | -30.62% |
| 2021 | 56.18% |
| 2020 | -8.55% |
| 2019 | 34.63% |
FAF Dividends
| Ex-Dividend Date | Type | Payout Amount | Change | ||||||
|---|---|---|---|---|---|---|---|---|---|
| Loading, please wait... | |||||||||
Continue Researching FAF
Want to see what other sources are saying about First American Financial Corp's financials and stock price? Try the links below:First American Financial Corp (FAF) Stock Price | Nasdaq
First American Financial Corp (FAF) Stock Quote, History and News - Yahoo Finance
First American Financial Corp (FAF) Stock Price and Basic Information | MarketWatch
Loading social stream, please wait...