FirstRand Limited (FANDY): Price and Financial Metrics
FANDY Price/Volume Stats
| Current price | $42.23 | 52-week high | $43.75 |
| Prev. close | $43.41 | 52-week low | $30.60 |
| Day low | $42.23 | Volume | 800 |
| Day high | $42.23 | Avg. volume | 627 |
| 50-day MA | $36.58 | Dividend yield | 2.82% |
| 200-day MA | $0.00 | Market Cap | N/A |
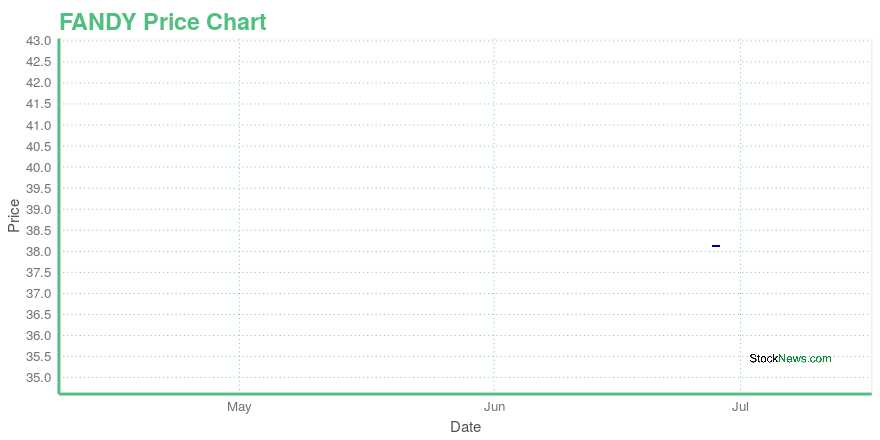
FANDY Stock Price Chart Interactive Chart >
FirstRand Limited (FANDY) Company Bio
FirstRand Limited, together with its subsidiaries, provides banking, transactional, lending, insurance, and investment products and services to retail, commercial, corporate, and public sector customers primarily in South Africa, rest of Africa, and the United Kingdom. The company offers personal loans and short-term insurance; asset and invoice finance, as well as SME commercial, residential, and buy-to-let mortgages; and vehicle finance, installment credit and fleet management, and corporate and investment banking services. It also provides asset management, as well as vehicle-related insurance services. FirstRand Limited was founded in 1998 and is based in Sandton, South Africa.
FANDY Price Returns
| 1-mo | N/A |
| 3-mo | N/A |
| 6-mo | N/A |
| 1-year | N/A |
| 3-year | N/A |
| 5-year | -4.02% |
| YTD | N/A |
| 2023 | N/A |
| 2022 | N/A |
| 2021 | N/A |
| 2020 | 0.00% |
| 2019 | -1.27% |
FANDY Dividends
| Ex-Dividend Date | Type | Payout Amount | Change | ||||||
|---|---|---|---|---|---|---|---|---|---|
| Loading, please wait... | |||||||||


Loading social stream, please wait...