Farmer Brothers Company (FARM): Price and Financial Metrics

Farmer Brothers Company (FARM): $2.58

0.12 (+4.88%)

POWR Rating

Component Grades

Momentum

C

Stability

D

Sentiment

Quality

C

Add FARM to Watchlist
Sign Up

Industry: Consumer Goods

Industry

C

Ranked

#32 of 53

in industry

FARM Price/Volume Stats
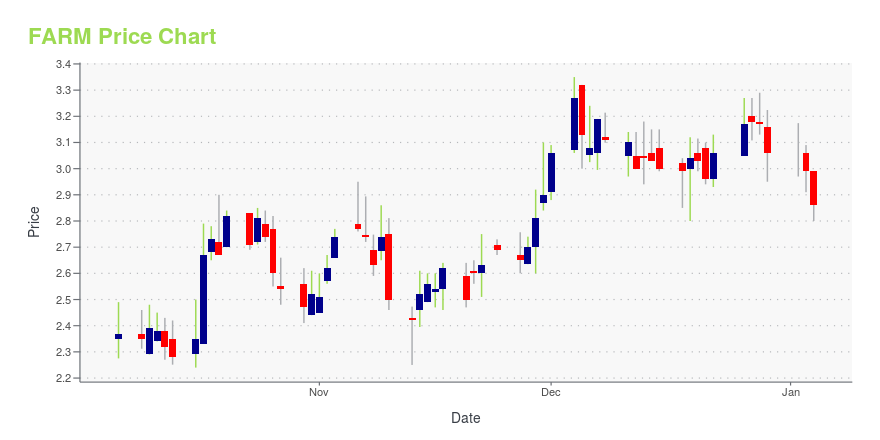
Current price $2.58 52-week high $6.83
Prev. close $2.46 52-week low $1.75
Day low $2.46 Volume 66,800
Day high $2.63 Avg. volume 746,166
50-day MA $2.52 Dividend yield N/A
200-day MA $3.37 Market Cap 52.52M

FARM Stock Price Chart Interactive Chart >

FARM POWR Grades

  • Value is the dimension where FARM ranks best; there it ranks ahead of 70.55% of US stocks.
  • FARM's strongest trending metric is Stability; it's been moving down over the last 177 days.
  • FARM ranks lowest in Stability; there it ranks in the 15th percentile.

FARM Stock Summary

  • Of note is the ratio of FARMER BROTHERS CO's sales and general administrative expense to its total operating expenses; 98.49% of US stocks have a lower such ratio.
  • Over the past twelve months, FARM has reported earnings growth of 991.27%, putting it ahead of 98.33% of US stocks in our set.
  • FARMER BROTHERS CO's shareholder yield -- a measure of how much capital is returned to stockholders via dividends and buybacks -- is 160.89%, greater than the shareholder yield of 98.52% of stocks in our set.
  • Stocks with similar financial metrics, market capitalization, and price volatility to FARMER BROTHERS CO are LWAY, ODC, OII, PRTS, and CMT.
  • FARM's SEC filings can be seen here. And to visit FARMER BROTHERS CO's official web site, go to www.farmerbros.com.

FARM Valuation Summary

  • FARM's EV/EBIT ratio is -1.4; this is 108.09% lower than that of the median Consumer Defensive stock.
  • Over the past 234 months, FARM's price/sales ratio has gone down 2.

Below are key valuation metrics over time for FARM.

Stock Date P/S P/B P/E EV/EBIT
FARM 2023-09-22 0.2 1.4 -0.7 -1.4
FARM 2023-09-21 0.2 1.5 -0.7 -1.4
FARM 2023-09-20 0.2 1.4 -0.7 -1.4
FARM 2023-09-19 0.2 1.5 -0.7 -1.4
FARM 2023-09-18 0.1 1.3 -0.6 -1.3
FARM 2023-09-15 0.2 1.4 -0.7 -1.4

FARM Growth Metrics

    The 4 year price growth rate now stands at -74.55%.
  • Its 2 year cash and equivalents growth rate is now at -60.01%.
  • Its 5 year revenue growth rate is now at 3.77%.
FARM's revenue has moved down $65,829,000 over the prior 34 months.

The table below shows FARM's growth in key financial areas (numbers in millions of US dollars).

Date Revenue Operating Cash Flow Net Income to Common Stock
2022-12-31 496.458 0.704 -29.098
2022-09-30 482.211 -18.138 -21.058
2022-06-30 469.193 -11.454 -16.255
2022-03-31 449.062 -7.625 -16.445
2021-12-31 422.816 -6.258 -26.084
2021-09-30 408.942 -17.206 -38.384

FARM's Quality Factors

The “Quality” component of the POWR Ratings focuses on 31 different factors of a companies fundamentals and operational strength. Here are some key insights as we drill into the specifics of these quality attributes.
  • FARM has a Quality Grade of C, ranking ahead of 59.18% of graded US stocks.
  • FARM's asset turnover comes in at 1.145 -- ranking 20th of 59 Food Products stocks.
  • HRL, TR, and JJSF are the stocks whose asset turnover ratios are most correlated with FARM.

The table below shows FARM's key quality metrics over time.

Period Asset Turnover Gross Margin ROIC
2021-06-30 1.145 0.254 -0.034
2021-03-31 1.042 0.234 -0.058
2020-12-31 1.099 0.248 -0.133
2020-09-30 1.165 0.261 -0.101
2020-06-30 1.205 0.276 -0.072
2020-03-31 1.326 0.285 -0.071

FARM Price Target

For more insight on analysts targets of FARM, see our FARM price target page. And for a list of of all stocks sorted by upside potential based on analyst target price, see our Top Price Target page.

Average Price Target $14.00 Average Broker Recommendation 1.5 (Moderate Buy)

Farmer Brothers Company (FARM) Company Bio


Farmer Bros. Company manufactures, wholesales, and distributes coffee, tea, and culinary products in the United States. The company was founded in 1912 and is based in Torrance, California.


FARM Latest News Stream


Event/Time News Detail
Loading, please wait...

FARM Latest Social Stream


Loading social stream, please wait...

View Full FARM Social Stream

Latest FARM News From Around the Web

Below are the latest news stories about FARMER BROTHERS CO that investors may wish to consider to help them evaluate FARM as an investment opportunity.

Earnings Miss of the Week: Slowing Sales, High Costs Impact Farmer Brothers Profits

Specialty coffee roaster Farmer Brothers missed profit expectations for the quarter ended June 30, as slowing sales growth and persistently high coffee prices weighed on profitability.

Yahoo | September 16, 2023

Q4 2023 Farmer Bros Co Earnings Call

Q4 2023 Farmer Bros Co Earnings Call

Yahoo | September 13, 2023

Farmer Brothers (FARM) Q4 Loss Wider Than Expected, Sales Up Y/Y

Farmer Brothers' (FARM) fiscal fourth-quarter sales increase by 1.1%, supported by effective pricing actions, partially offset by lower volumes.

Yahoo | September 13, 2023

Farmer Brothers (FARM) Reports Q4 Loss, Tops Revenue Estimates

Farmer Brothers (FARM) delivered earnings and revenue surprises of -37.70% and 0.35%, respectively, for the quarter ended June 2023. Do the numbers hold clues to what lies ahead for the stock?

Yahoo | September 12, 2023

Farmer Brothers reports fourth quarter and fiscal 2023 financial results and publishes quarterly shareholder letter

Fiscal year 2023 net sales from continuing operations of $340 million Used $100 million proceeds from direct ship and Northlake, Texas facility transaction to significantly pay down debt NORTHLAKE, Texas, Sept. 12, 2023 (GLOBE NEWSWIRE) -- Farmer Brothers (NASDAQ: FARM) today reported its fiscal fourth quarter and full year 2023 financial results for the period ended June 30, 2023. The company filed its 10-K and published its quarterly shareholder letter, which contains additional details regard

Yahoo | September 12, 2023

Read More 'FARM' Stories Here

FARM Price Returns

1-mo 23.44%
3-mo N/A
6-mo -28.13%
1-year -44.99%
3-year -44.40%
5-year -89.65%
YTD -44.03%
2022 -38.12%
2021 59.53%
2020 -68.99%
2019 -35.45%
2018 -27.43%

Get Free Updates

Join thousands of investors who get the latest news, insights and top rated picks from StockNews.com!