FARO Technologies, Inc. (FARO): Price and Financial Metrics
FARO Price/Volume Stats
Current price | $19.40 | 52-week high | $36.74 |
Prev. close | $19.24 | 52-week low | $10.30 |
Day low | $19.04 | Volume | 139,053 |
Day high | $19.50 | Avg. volume | 247,083 |
50-day MA | $15.98 | Dividend yield | N/A |
200-day MA | $17.71 | Market Cap | 367.71M |
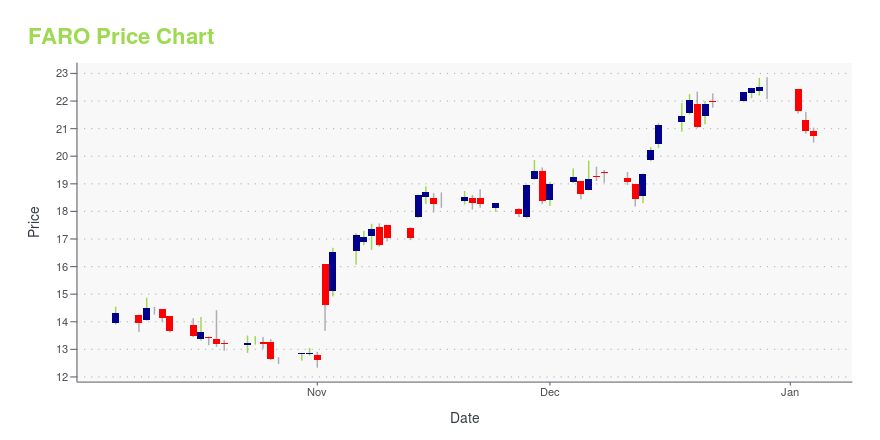
FARO Stock Price Chart Interactive Chart >
FARO POWR Grades
- Growth is the dimension where FARO ranks best; there it ranks ahead of 85.58% of US stocks.
- FARO's strongest trending metric is Momentum; it's been moving down over the last 177 days.
- FARO's current lowest rank is in the Sentiment metric (where it is better than 15.76% of US stocks).
FARO Stock Summary
- With a year-over-year growth in debt of 349.57%, FARO TECHNOLOGIES INC's debt growth rate surpasses 97.17% of about US stocks.
- Over the past twelve months, FARO has reported earnings growth of 210.33%, putting it ahead of 94.09% of US stocks in our set.
- Shareholder yield, a measure of how much is returned to shareholders via dividends and share repurchases, for FARO comes in at -20.33% -- higher than that of merely 15.7% of stocks in our set.
- Stocks with similar financial metrics, market capitalization, and price volatility to FARO TECHNOLOGIES INC are RCEL, BKYI, INVE, SCPH, and CETX.
- Visit FARO's SEC page to see the company's official filings. To visit the company's web site, go to www.faro.com.
FARO Valuation Summary
- FARO's EV/EBIT ratio is -7.1; this is 134.22% lower than that of the median Technology stock.
- Over the past 243 months, FARO's EV/EBIT ratio has gone down 46.9.
Below are key valuation metrics over time for FARO.
Stock | Date | P/S | P/B | P/E | EV/EBIT |
---|---|---|---|---|---|
FARO | 2023-11-28 | 1.0 | 1.4 | -6.0 | -7.1 |
FARO | 2023-11-27 | 0.9 | 1.3 | -5.6 | -6.7 |
FARO | 2023-11-24 | 1.0 | 1.3 | -5.7 | -6.8 |
FARO | 2023-11-22 | 1.0 | 1.3 | -5.7 | -6.8 |
FARO | 2023-11-21 | 1.0 | 1.3 | -5.7 | -6.8 |
FARO | 2023-11-20 | 1.0 | 1.4 | -5.8 | -6.9 |
FARO Growth Metrics
- Its year over year price growth rate is now at -50.9%.
- Its year over year net cashflow from operations growth rate is now at -96.41%.
- Its 5 year net income to common stockholders growth rate is now at -1274.57%.

The table below shows FARO's growth in key financial areas (numbers in millions of US dollars).
Date | Revenue | Operating Cash Flow | Net Income to Common Stock |
---|---|---|---|
2022-12-31 | 345.765 | -24.856 | -26.756 |
2022-09-30 | 342.109 | -16.061 | -56.234 |
2022-06-30 | 335.946 | -4.427 | -53.828 |
2022-03-31 | 338.139 | -10.227 | -46.43 |
2021-12-31 | 337.814 | -13.476 | -39.964 |
2021-09-30 | 330.563 | -4.993 | 19.156 |
FARO's Quality Factors
The “Quality” component of the POWR Ratings focuses on 31 different factors of a companies fundamentals and operational strength. Here are some key insights as we drill into the specifics of these quality attributes.- FARO has a Quality Grade of B, ranking ahead of 78% of graded US stocks.
- FARO's asset turnover comes in at 0.65 -- ranking 33rd of 75 Measuring and Control Equipment stocks.
- TRNS, AXDX, and BRKR are the stocks whose asset turnover ratios are most correlated with FARO.
The table below shows FARO's key quality metrics over time.
Period | Asset Turnover | Gross Margin | ROIC |
---|---|---|---|
2021-06-30 | 0.650 | 0.537 | -0.044 |
2021-03-31 | 0.623 | 0.520 | -0.113 |
2020-12-31 | 0.639 | 0.526 | -0.196 |
2020-09-30 | 0.677 | 0.485 | -0.506 |
2020-06-30 | 0.698 | 0.499 | -0.461 |
2020-03-31 | 0.740 | 0.518 | -0.383 |
FARO Price Target
For more insight on analysts targets of FARO, see our FARO price target page. And for a list of of all stocks sorted by upside potential based on analyst target price, see our Top Price Target page.
Average Price Target | $91.67 | Average Broker Recommendation | 1.62 (Moderate Buy) |
FARO Technologies, Inc. (FARO) Company Bio
FARO Technologies designs, develops, manufactures, markets, and supports software driven, three-dimensional (3-D) measurement, imaging, and realization systems for manufacturing, industrial, architecture, surveying, building construction, and law enforcement applications. The company was founded in 1981 and is based in Lake Mary, Florida.
Latest FARO News From Around the Web
Below are the latest news stories about FARO TECHNOLOGIES INC that investors may wish to consider to help them evaluate FARO as an investment opportunity.
Lead Independent Director of FARO Technologies Alexander Davern Buys 46% More SharesThose following along with FARO Technologies, Inc. ( NASDAQ:FARO ) will no doubt be intrigued by the recent purchase of... |
FARO Technologies, Inc. (NASDAQ:FARO) Q3 2023 Earnings Call TranscriptFARO Technologies, Inc. (NASDAQ:FARO) Q3 2023 Earnings Call Transcript November 4, 2023 Operator: Good day, everyone, and welcome to the FARO Technologies Third Quarter 2023 Earnings Call. For opening remarks and introductions, I’ll now turn the call over to Michael Funari at Sapphire Investor Relations. Please go ahead, sir. Michael Funari: Thank you, and good […] |
Faro Technologies Inc (FARO) Reports Q3 2023 Earnings: Revenue Up 2% YoYSoftware sales and recurring revenue also see growth; Net loss widens |
FARO Announces Third Quarter Financial ResultsFARO® Technologies, Inc. (Nasdaq: FARO), a global leader in 4D digital reality solutions, today announced its financial results for the third quarter ended September 30, 2023. |
FARO to Announce Financial Results for the Third Quarter 2023 on November 2, 2023FARO® Technologies (Nasdaq: FARO), a pioneer in the field of 3D measurement, imaging, and realization technology, today announced that after market close on Wednesday, November 1, 2023, it will release its financial results for the third quarter ended September 30, 2023. In conjunction with the release, Peter Lau, President and Chief Executive Officer, and Allen Muhich, Chief Financial Officer, will host a conference call on Thursday, November 2, 2023 at 8:00 am. ET. |
FARO Price Returns
1-mo | 11.62% |
3-mo | 29.16% |
6-mo | 28.05% |
1-year | -39.70% |
3-year | -71.11% |
5-year | -55.79% |
YTD | -34.04% |
2022 | -58.00% |
2021 | -0.86% |
2020 | 40.28% |
2019 | 23.89% |
2018 | -13.53% |
Continue Researching FARO
Here are a few links from around the web to help you further your research on Faro Technologies Inc's stock as an investment opportunity:Faro Technologies Inc (FARO) Stock Price | Nasdaq
Faro Technologies Inc (FARO) Stock Quote, History and News - Yahoo Finance
Faro Technologies Inc (FARO) Stock Price and Basic Information | MarketWatch
Loading social stream, please wait...