Franklin Covey Company (FC): Price and Financial Metrics
FC Price/Volume Stats
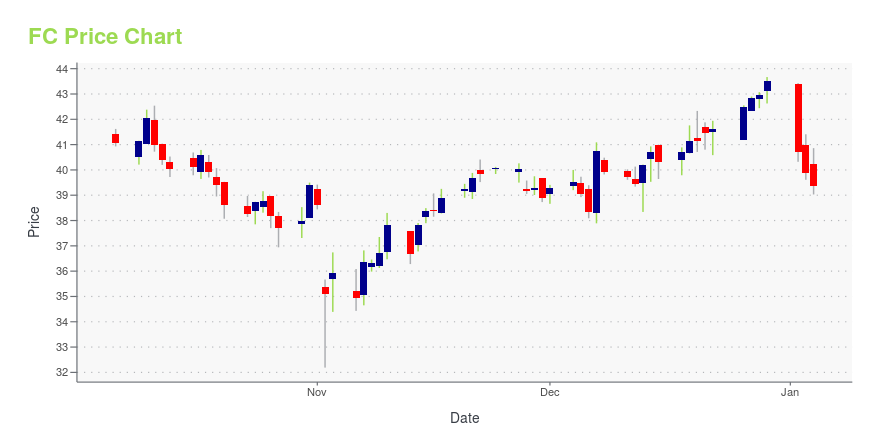
Current price | $39.35 | 52-week high | $52.00 |
Prev. close | $38.88 | 52-week low | $32.19 |
Day low | $38.66 | Volume | 42,848 |
Day high | $39.41 | Avg. volume | 73,232 |
50-day MA | $39.50 | Dividend yield | N/A |
200-day MA | $41.17 | Market Cap | 528.59M |
FC Stock Price Chart Interactive Chart >
FC POWR Grades
- Quality is the dimension where FC ranks best; there it ranks ahead of 99.22% of US stocks.
- The strongest trend for FC is in Quality, which has been heading up over the past 177 days.
- FC ranks lowest in Growth; there it ranks in the 25th percentile.
FC Stock Summary
- FRANKLIN COVEY CO's capital turnover -- a measure of revenue relative to shareholder's equity -- is better than 86.2% of US listed stocks.
- The ratio of debt to operating expenses for FRANKLIN COVEY CO is higher than it is for about merely 14.04% of US stocks.
- With a year-over-year growth in debt of -33.71%, FRANKLIN COVEY CO's debt growth rate surpasses only 9.5% of about US stocks.
- If you're looking for stocks that are quantitatively similar to FRANKLIN COVEY CO, a group of peers worth examining would be THR, CHX, ADUS, SMPL, and OPCH.
- FC's SEC filings can be seen here. And to visit FRANKLIN COVEY CO's official web site, go to www.franklincovey.com.
FC Valuation Summary
- In comparison to the median Industrials stock, FC's price/sales ratio is 2.86% lower, now standing at 1.7.
- FC's price/earnings ratio has moved up 33.5 over the prior 243 months.
Below are key valuation metrics over time for FC.
Stock | Date | P/S | P/B | P/E | EV/EBIT |
---|---|---|---|---|---|
FC | 2023-11-09 | 1.7 | 6.5 | 29.3 | 18.3 |
FC | 2023-11-08 | 1.7 | 6.4 | 29.0 | 18.1 |
FC | 2023-11-07 | 1.7 | 6.4 | 29.0 | 18.1 |
FC | 2023-11-06 | 1.6 | 6.2 | 27.9 | 17.4 |
FC | 2023-11-03 | 1.7 | 6.4 | 28.7 | 17.9 |
FC | 2023-11-02 | 1.6 | 6.2 | 28.0 | 17.5 |
FC Growth Metrics
- Its year over year net cashflow from operations growth rate is now at 47.98%.
- Its 3 year net income to common stockholders growth rate is now at 459.76%.
- The year over year net income to common stockholders growth rate now stands at 285.35%.

The table below shows FC's growth in key financial areas (numbers in millions of US dollars).
Date | Revenue | Operating Cash Flow | Net Income to Common Stock |
---|---|---|---|
2022-12-31 | 270.95 | 45.107 | 19.285 |
2022-09-30 | 262.841 | 52.254 | 18.43 |
2022-06-30 | 252.979 | 54.861 | 14.659 |
2022-03-31 | 245.539 | 47.503 | 20.251 |
2021-12-31 | 237.102 | 45.465 | 18.327 |
2021-09-30 | 224.168 | 46.177 | 13.623 |
FC's Quality Factors
The “Quality” component of the POWR Ratings focuses on 31 different factors of a companies fundamentals and operational strength. Here are some key insights as we drill into the specifics of these quality attributes.- FC has a Quality Grade of A, ranking ahead of 97.73% of graded US stocks.
- FC's asset turnover comes in at 1.005 -- ranking 128th of 561 Business Services stocks.
- V, FTAI, and CELP are the stocks whose asset turnover ratios are most correlated with FC.
The table below shows FC's key quality metrics over time.
Period | Asset Turnover | Gross Margin | ROIC |
---|---|---|---|
2021-05-31 | 1.005 | 0.771 | 0.261 |
2021-02-28 | 0.920 | 0.758 | 0.113 |
2020-11-30 | 0.944 | 0.743 | 0.065 |
2020-08-31 | 0.977 | 0.733 | 0.055 |
2020-05-31 | 1.032 | 0.722 | 0.131 |
2020-02-29 | 1.131 | 0.719 | 0.107 |
FC Price Target
For more insight on analysts targets of FC, see our FC price target page. And for a list of of all stocks sorted by upside potential based on analyst target price, see our Top Price Target page.
Average Price Target | $45.00 | Average Broker Recommendation | 1.5 (Moderate Buy) |
Franklin Covey Company (FC) Company Bio
Franklin Covey provides training and consulting services in the areas of leadership, productivity, strategic execution, trust, sales force performance, customer loyalty, and communication effectiveness skills worldwide. The company was founded in 1983 and is based in Salt Lake City, Utah.
Latest FC News From Around the Web
Below are the latest news stories about FRANKLIN COVEY CO that investors may wish to consider to help them evaluate FC as an investment opportunity.
Why the Market Dipped But Franklin Covey (FC) Gained TodayIn the closing of the recent trading day, Franklin Covey (FC) stood at $39.67, denoting a +1.07% change from the preceding trading day. |
Franklin Covey (FC) Laps the Stock Market: Here's WhyIn the closing of the recent trading day, Franklin Covey (FC) stood at $38.39, denoting a +1.51% change from the preceding trading day. |
Franklin Covey Co. (NYSE:FC) Q4 2023 Earnings Call TranscriptFranklin Covey Co. (NYSE:FC) Q4 2023 Earnings Call Transcript November 1, 2023 Franklin Covey Co. reports earnings inline with expectations. Reported EPS is $0.49 EPS, expectations were $0.49. Operator: Good day and thank you for standing by. Welcome to the Q4 2023 Franklin Covey Earnings Conference Call. At this time, all participants are in a […] |
Q4 2023 Franklin Covey Co Earnings CallQ4 2023 Franklin Covey Co Earnings Call |
FranklinCovey Launches Next Generation Courses, Leading at the Speed of Trust and Working at the Speed of Trust, to Meet the Challenges Organizations Are Facing TodaySALT LAKE CITY, November 02, 2023--FranklinCovey Launches Next Generation Courses: Leading at the Speed of Trust and Working at the Speed of Trust to Meet Challenges Organizations Face |
FC Price Returns
1-mo | 1.86% |
3-mo | -6.13% |
6-mo | 3.69% |
1-year | -24.63% |
3-year | 71.16% |
5-year | 66.10% |
YTD | -15.86% |
2022 | 0.88% |
2021 | 108.17% |
2020 | -30.90% |
2019 | 44.33% |
2018 | 7.61% |
Continue Researching FC
Want to do more research on Franklin Covey Co's stock and its price? Try the links below:Franklin Covey Co (FC) Stock Price | Nasdaq
Franklin Covey Co (FC) Stock Quote, History and News - Yahoo Finance
Franklin Covey Co (FC) Stock Price and Basic Information | MarketWatch
Loading social stream, please wait...