
First Community Corporation (FCCO): Price and Financial Metrics
FCCO Price/Volume Stats
| Current price | $22.75 | 52-week high | $23.30 |
| Prev. close | $23.19 | 52-week low | $15.40 |
| Day low | $22.64 | Volume | 36,700 |
| Day high | $23.30 | Avg. volume | 33,041 |
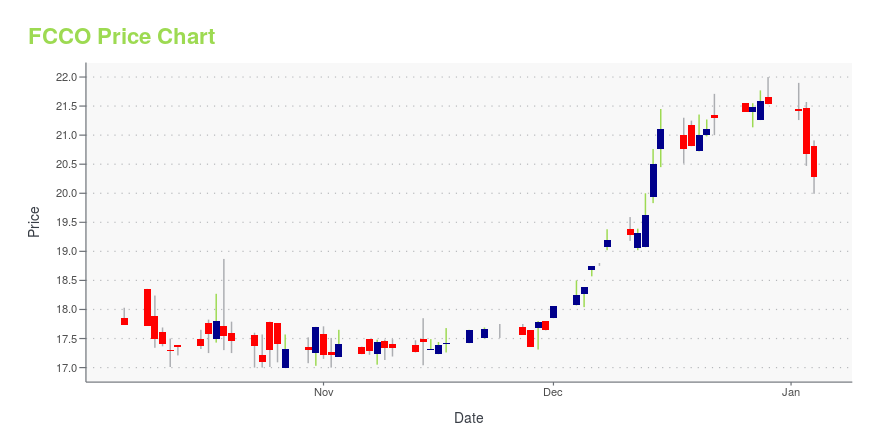
| 50-day MA | $17.76 | Dividend yield | 2.51% |
| 200-day MA | $17.72 | Market Cap | 173.56M |
FCCO Stock Price Chart Interactive Chart >
First Community Corporation (FCCO) Company Bio
First Community Corporation operates as the bank holding company for First Community Bank which offers various commercial and retail banking products and services to small-to-medium sized businesses, professional concerns, and individuals in South Carolina and Georgia. The company was founded in 1994 and is based in Lexington, South Carolina.
Latest FCCO News From Around the Web
Below are the latest news stories about FIRST COMMUNITY CORP that investors may wish to consider to help them evaluate FCCO as an investment opportunity.
First Community Corporation Announces 2024 Earnings Release ScheduleToday, First Community Corporation (Nasdaq: FCCO), the holding company for First Community Bank, announced the company's earnings release schedule for 2024. |
First Community Announces Leadership MovesToday, First Community Corporation (Nasdaq: FCCO), the holding company for First Community Bank, announced promotions and additions to its Executive Leadership Team. Effective July 1, 2024, J. Ted Nissen will become the CEO of First Community Bank while still retaining the role of President and will also be joining First Community's Board of Directors. Effective January 1, 2024, Joseph A. "Drew" Painter and Vaughan R. Dozier, Jr. will become Executive Vice Presidents in the roles of Co-Chief Com |
With 48% stake, First Community Corporation (NASDAQ:FCCO) seems to have captured institutional investors' interestKey Insights Given the large stake in the stock by institutions, First Community's stock price might be vulnerable to... |
Should You Buy First Community Corporation (NASDAQ:FCCO) For Its Upcoming Dividend?Some investors rely on dividends for growing their wealth, and if you're one of those dividend sleuths, you might be... |
First Community Corp (FCCO) Reports Q3 2023 Earnings and Announces Cash DividendNet income dips while loan growth and deposit franchise remain strong |
FCCO Price Returns
| 1-mo | 30.00% |
| 3-mo | 36.80% |
| 6-mo | 20.04% |
| 1-year | 21.88% |
| 3-year | 18.95% |
| 5-year | 32.65% |
| YTD | 7.38% |
| 2023 | 1.21% |
| 2022 | 7.72% |
| 2021 | 26.04% |
| 2020 | -18.93% |
| 2019 | 13.78% |
FCCO Dividends
| Ex-Dividend Date | Type | Payout Amount | Change | ||||||
|---|---|---|---|---|---|---|---|---|---|
| Loading, please wait... | |||||||||
Continue Researching FCCO
Here are a few links from around the web to help you further your research on First Community Corp's stock as an investment opportunity:First Community Corp (FCCO) Stock Price | Nasdaq
First Community Corp (FCCO) Stock Quote, History and News - Yahoo Finance
First Community Corp (FCCO) Stock Price and Basic Information | MarketWatch
Loading social stream, please wait...