FirstCash, Inc. (FCFS): Price and Financial Metrics
GET POWR RATINGS... FREE!
FCFS POWR Grades
- Growth is the dimension where FCFS ranks best; there it ranks ahead of 96.05% of US stocks.
- FCFS's strongest trending metric is Growth; it's been moving up over the last 178 days.
- FCFS ranks lowest in Momentum; there it ranks in the 22nd percentile.
FCFS Stock Summary
- Of note is the ratio of FIRSTCASH HOLDINGS INC's sales and general administrative expense to its total operating expenses; 97.34% of US stocks have a lower such ratio.
- In terms of twelve month growth in earnings before interest and taxes, FIRSTCASH HOLDINGS INC is reporting a growth rate of 98.27%; that's higher than 86.03% of US stocks.
- As for revenue growth, note that FCFS's revenue has grown 60.62% over the past 12 months; that beats the revenue growth of 87.62% of US companies in our set.
- Stocks with similar financial metrics, market capitalization, and price volatility to FIRSTCASH HOLDINGS INC are TGLS, RRX, VSH, SRCL, and BLD.
- FCFS's SEC filings can be seen here. And to visit FIRSTCASH HOLDINGS INC's official web site, go to www.firstcash.com.
FCFS Valuation Summary
- In comparison to the median Financial Services stock, FCFS's price/earnings ratio is 72.63% higher, now standing at 16.4.
- Over the past 243 months, FCFS's price/earnings ratio has gone up 8.
Below are key valuation metrics over time for FCFS.
Stock | Date | P/S | P/B | P/E | EV/EBIT |
---|---|---|---|---|---|
FCFS | 2023-03-17 | 1.5 | 2.2 | 16.4 | 14.5 |
FCFS | 2023-03-16 | 1.6 | 2.3 | 17.0 | 14.9 |
FCFS | 2023-03-15 | 1.6 | 2.3 | 16.8 | 14.7 |
FCFS | 2023-03-14 | 1.6 | 2.3 | 16.7 | 14.7 |
FCFS | 2023-03-13 | 1.5 | 2.2 | 16.1 | 14.3 |
FCFS | 2023-03-10 | 1.5 | 2.2 | 16.1 | 14.3 |
FCFS Growth Metrics
- Its 2 year net income to common stockholders growth rate is now at -23.04%.
- Its 2 year revenue growth rate is now at 4.7%.
- Its year over year cash and equivalents growth rate is now at 107.38%.

The table below shows FCFS's growth in key financial areas (numbers in millions of US dollars).
Date | Revenue | Operating Cash Flow | Net Income to Common Stock |
---|---|---|---|
2022-12-31 | 2,728.942 | 469.305 | 253.495 |
2022-09-30 | 2,481.372 | 411.252 | 202.8 |
2022-06-30 | 2,208.903 | 336.322 | 176.88 |
2022-03-31 | 1,950.865 | 274.275 | 119.199 |
2021-12-31 | 1,698.965 | 223.304 | 124.909 |
2021-09-30 | 1,589.349 | 182.748 | 128.264 |
FCFS's Quality Factors
The “Quality” component of the POWR Ratings focuses on 31 different factors of a companies fundamentals and operational strength. Here are some key insights as we drill into the specifics of these quality attributes.- FCFS has a Quality Grade of C, ranking ahead of 48.6% of graded US stocks.
- FCFS's asset turnover comes in at 0.658 -- ranking 153rd of 165 Retail stocks.
- CNXN, NUZE, and VLGEA are the stocks whose asset turnover ratios are most correlated with FCFS.
The table below shows FCFS's key quality metrics over time.
Period | Asset Turnover | Gross Margin | ROIC |
---|---|---|---|
2021-09-30 | 0.658 | 0.577 | 0.102 |
2021-06-30 | 0.662 | 0.572 | 0.093 |
2021-03-31 | 0.692 | 0.563 | 0.097 |
2020-12-31 | 0.717 | 0.559 | 0.095 |
2020-09-30 | 0.758 | 0.548 | 0.109 |
2020-06-30 | 0.782 | 0.547 | 0.123 |
FCFS Price Target
For more insight on analysts targets of FCFS, see our FCFS price target page. And for a list of of all stocks sorted by upside potential based on analyst target price, see our Top Price Target page.
Average Price Target | $88.17 | Average Broker Recommendation | 1.86 (Hold) |
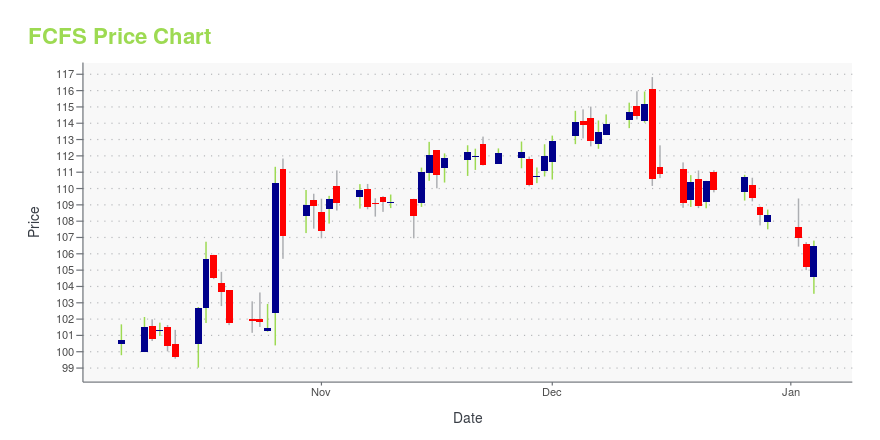
FCFS Stock Price Chart Interactive Chart >
FCFS Price/Volume Stats
Current price | $94.56 | 52-week high | $100.00 |
Prev. close | $90.95 | 52-week low | $63.43 |
Day low | $92.00 | Volume | 253,726 |
Day high | $94.61 | Avg. volume | 218,849 |
50-day MA | $89.92 | Dividend yield | 1.47% |
200-day MA | $82.62 | Market Cap | 4.38B |
FirstCash, Inc. (FCFS) Company Bio
First Cash Financial Services focuses on serving cash and credit constrained consumers through its retail pawn locations. The company was founded in 1988 and is based in Arlington, Texas.
Latest FCFS News From Around the Web
Below are the latest news stories about FIRSTCASH HOLDINGS INC that investors may wish to consider to help them evaluate FCFS as an investment opportunity.
FirstCash Holdings (FCFS) Gains As Market Dips: What You Should KnowIn the latest trading session, FirstCash Holdings (FCFS) closed at $92, marking a +0.34% move from the previous day. |
FirstCash Holdings (NASDAQ:FCFS) shareholders have earned a 51% return over the last yearPassive investing in index funds can generate returns that roughly match the overall market. But if you pick the right... |
FirstCash Holdings (FCFS) Gains But Lags Market: What You Should KnowIn the latest trading session, FirstCash Holdings (FCFS) closed at $90.06, marking a +1.01% move from the previous day. |
There's A Lot To Like About FirstCash Holdings' (NASDAQ:FCFS) Upcoming US$0.33 DividendFirstCash Holdings, Inc. ( NASDAQ:FCFS ) stock is about to trade ex-dividend in four days. The ex-dividend date occurs... |
FirstCash Holdings (FCFS) Surpasses Q4 Earnings and Revenue EstimatesFirstCash (FCFS) delivered earnings and revenue surprises of 5.77% and 2.42%, respectively, for the quarter ended December 2022. Do the numbers hold clues to what lies ahead for the stock? |
FCFS Price Returns
1-mo | 3.86% |
3-mo | 8.04% |
6-mo | 20.43% |
1-year | 41.68% |
3-year | 52.85% |
5-year | 25.75% |
YTD | 9.20% |
2022 | 18.03% |
2021 | 8.47% |
2020 | -11.74% |
2019 | 12.72% |
2018 | 8.48% |
FCFS Dividends
Ex-Dividend Date | Type | Payout Amount | Change | ||||||
---|---|---|---|---|---|---|---|---|---|
Loading, please wait... |
Continue Researching FCFS
Want to do more research on Firstcash Inc's stock and its price? Try the links below:Firstcash Inc (FCFS) Stock Price | Nasdaq
Firstcash Inc (FCFS) Stock Quote, History and News - Yahoo Finance
Firstcash Inc (FCFS) Stock Price and Basic Information | MarketWatch
Loading social stream, please wait...