Freeport-McMoRan, Inc. (FCX): Price and Financial Metrics
FCX Price/Volume Stats
Current price | $39.24 | 52-week high | $46.73 |
Prev. close | $37.32 | 52-week low | $32.83 |
Day low | $37.74 | Volume | 18,613,585 |
Day high | $39.46 | Avg. volume | 11,668,224 |
50-day MA | $35.69 | Dividend yield | 0.81% |
200-day MA | $38.47 | Market Cap | 56.27B |
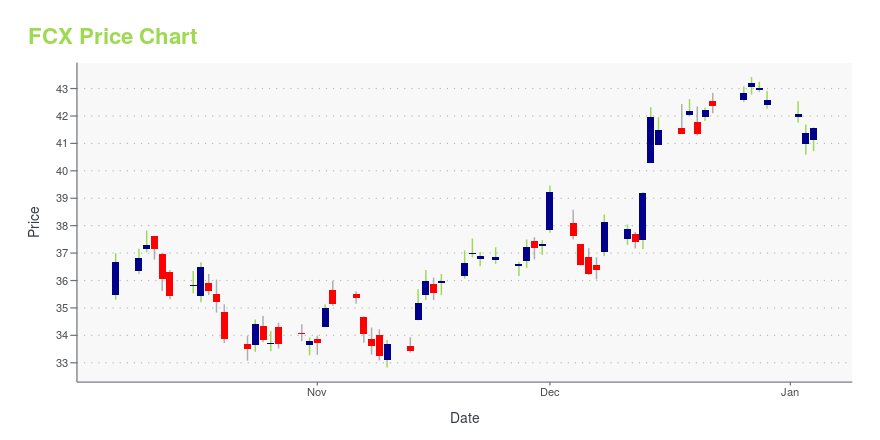
FCX Stock Price Chart Interactive Chart >
FCX POWR Grades
- FCX scores best on the Quality dimension, with a Quality rank ahead of 77.51% of US stocks.
- The strongest trend for FCX is in Quality, which has been heading down over the past 177 days.
- FCX ranks lowest in Growth; there it ranks in the 26th percentile.
FCX Stock Summary
- FCX has a market capitalization of $48,296,353,578 -- more than approximately 95.38% of US stocks.
- For FCX, its debt to operating expenses ratio is greater than that reported by 92.18% of US equities we're observing.
- In terms of volatility of its share price, FCX is more volatile than merely 18.41% of stocks we're observing.
- Stocks with similar financial metrics, market capitalization, and price volatility to FREEPORT-MCMORAN INC are OXY, MSCI, DD, PCAR, and HWM.
- Visit FCX's SEC page to see the company's official filings. To visit the company's web site, go to www.fcx.com.
FCX Valuation Summary
- In comparison to the median Basic Materials stock, FCX's price/sales ratio is 23.53% higher, now standing at 2.1.
- FCX's price/sales ratio has moved down 0.7 over the prior 243 months.
Below are key valuation metrics over time for FCX.
Stock | Date | P/S | P/B | P/E | EV/EBIT |
---|---|---|---|---|---|
FCX | 2023-11-10 | 2.1 | 2.9 | 22.4 | 10.6 |
FCX | 2023-11-09 | 2.1 | 2.9 | 22.1 | 10.5 |
FCX | 2023-11-08 | 2.1 | 2.9 | 22.3 | 10.6 |
FCX | 2023-11-07 | 2.2 | 3.0 | 22.6 | 10.8 |
FCX | 2023-11-06 | 2.2 | 3.1 | 23.5 | 11.1 |
FCX | 2023-11-03 | 2.2 | 3.1 | 23.4 | 11.1 |
FCX Growth Metrics
- Its year over year net income to common stockholders growth rate is now at 182.91%.
- Its year over year revenue growth rate is now at 51.37%.
- Its 2 year cash and equivalents growth rate is now at 420.47%.

The table below shows FCX's growth in key financial areas (numbers in millions of US dollars).
Date | Revenue | Operating Cash Flow | Net Income to Common Stock |
---|---|---|---|
2022-12-31 | 22,780 | 5,139 | 3,468 |
2022-09-30 | 23,186 | 6,350 | 3,877 |
2022-06-30 | 24,266 | 7,557 | 4,872 |
2022-03-31 | 24,598 | 8,331 | 5,115 |
2021-12-31 | 22,845 | 7,715 | 4,306 |
2021-09-30 | 21,176 | 6,762 | 3,908 |
FCX's Quality Factors
The “Quality” component of the POWR Ratings focuses on 31 different factors of a companies fundamentals and operational strength. Here are some key insights as we drill into the specifics of these quality attributes.- FCX has a Quality Grade of B, ranking ahead of 78.34% of graded US stocks.
- FCX's asset turnover comes in at 0.44 -- ranking 16th of 42 Non-Metallic and Industrial Metal Mining stocks.
- USAS, UUUU, and SMTS are the stocks whose asset turnover ratios are most correlated with FCX.
The table below shows FCX's key quality metrics over time.
Period | Asset Turnover | Gross Margin | ROIC |
---|---|---|---|
2021-06-30 | 0.440 | 0.330 | 0.122 |
2021-03-31 | 0.389 | 0.277 | 0.086 |
2020-12-31 | 0.347 | 0.179 | 0.047 |
2020-09-30 | 0.335 | 0.119 | 0.025 |
2020-06-30 | 0.319 | 0.059 | 0.009 |
2020-03-31 | 0.329 | 0.039 | 0.004 |
FCX Price Target
For more insight on analysts targets of FCX, see our FCX price target page. And for a list of of all stocks sorted by upside potential based on analyst target price, see our Top Price Target page.
Average Price Target | $43.82 | Average Broker Recommendation | 1.55 (Moderate Buy) |
Freeport-McMoRan, Inc. (FCX) Company Bio
Freeport McMoran engages in the acquisition of mineral assets, and oil and natural gas resources. It primarily explores for copper, gold, molybdenum, cobalt, silver, and other metals, as well as oil and gas. The company was founded in 1987 and is based in Phoenix, Arizona.
Latest FCX News From Around the Web
Below are the latest news stories about FREEPORT-MCMORAN INC that investors may wish to consider to help them evaluate FCX as an investment opportunity.
COLUMN-Copper supply rethink as smelter treatment charges fall: Andy HomeChilean copper miner Antofagasta last week inked the first major 2024 concentrates supply deal with China's Jinchuan Group. It remains to be seen whether the terms form an annual benchmark for others. Indeed, it's far from certain there will be a single benchmark for next year due to a shifting copper concentrates landscape. |
Midday Movers: Best Buy and Lowe's Drop, Newmont and Freeport-McMoRan GainU.S. equities lost ground at midday on Tuesday, Nov. 21, 2023 as several retailers warned about consumer demand heading into the key holiday shopping period. |
Midday Movers: Boeing and GM Advance, Bristol-Myers Squibb DeclinesU.S. equities began the holiday-shortened trading week higher at midday on Monday, Nov. 20, 2023 after optimism about slowing inflation buoyed markets last week. |
There Are Reasons To Feel Uneasy About Freeport-McMoRan's (NYSE:FCX) Returns On CapitalIf we want to find a stock that could multiply over the long term, what are the underlying trends we should look for... |
Freeport CEO: 'encouraged' by signs of U.S.-China thawFreeport-McMoRan Inc (FCX.N) Chief Executive Richard Adkerson said on Thursday he is "encouraged" by signs of improving relations between the world's two biggest economies, including the talks held this week between U.S. President Joe Biden and Chinese President Xi Jinping. "The world would be a better place if there is a reasonable relationship between China and the United States," Adkerson said on the sidelines of the Asia Pacific Economic Cooperation (APEC) forum in San Francisco. Freeport is the world's largest publicly traded copper producer, with operations across North and South America. |
FCX Price Returns
1-mo | 16.40% |
3-mo | -5.04% |
6-mo | 6.33% |
1-year | 0.64% |
3-year | 72.50% |
5-year | 249.09% |
YTD | 4.79% |
2022 | -7.34% |
2021 | 61.41% |
2020 | 99.06% |
2019 | 29.59% |
2018 | -45.11% |
FCX Dividends
Ex-Dividend Date | Type | Payout Amount | Change | ||||||
---|---|---|---|---|---|---|---|---|---|
Loading, please wait... |
Continue Researching FCX
Want to see what other sources are saying about Freeport-Mcmoran Inc's financials and stock price? Try the links below:Freeport-Mcmoran Inc (FCX) Stock Price | Nasdaq
Freeport-Mcmoran Inc (FCX) Stock Quote, History and News - Yahoo Finance
Freeport-Mcmoran Inc (FCX) Stock Price and Basic Information | MarketWatch
Loading social stream, please wait...