Fresh Del Monte Produce, Inc. (FDP): Price and Financial Metrics
GET POWR RATINGS... FREE!
FDP POWR Grades
- FDP scores best on the Sentiment dimension, with a Sentiment rank ahead of 98.54% of US stocks.
- FDP's strongest trending metric is Sentiment; it's been moving up over the last 179 days.
- FDP's current lowest rank is in the Momentum metric (where it is better than 20.23% of US stocks).
FDP Stock Summary
- Of note is the ratio of FRESH DEL MONTE PRODUCE INC's sales and general administrative expense to its total operating expenses; 97.86% of US stocks have a lower such ratio.
- With a price/sales ratio of 0.32, FRESH DEL MONTE PRODUCE INC has a higher such ratio than only 10.93% of stocks in our set.
- The volatility of FRESH DEL MONTE PRODUCE INC's share price is greater than that of just 17.46% US stocks with at least 200 days of trading history.
- Stocks that are quantitatively similar to FDP, based on their financial statements, market capitalization, and price volatility, are DLA, UVV, HII, HEES, and AVNT.
- FDP's SEC filings can be seen here. And to visit FRESH DEL MONTE PRODUCE INC's official web site, go to www.freshdelmonte.com.
FDP Valuation Summary
- In comparison to the median Consumer Defensive stock, FDP's EV/EBIT ratio is 22.61% lower, now standing at 15.4.
- Over the past 243 months, FDP's price/sales ratio has gone down 0.2.
Below are key valuation metrics over time for FDP.
Stock | Date | P/S | P/B | P/E | EV/EBIT |
---|---|---|---|---|---|
FDP | 2023-02-24 | 0.3 | 0.8 | 15.1 | 15.4 |
FDP | 2023-02-23 | 0.3 | 0.8 | 15.0 | 15.3 |
FDP | 2023-02-22 | 0.3 | 0.8 | 15.3 | 15.6 |
FDP | 2023-02-21 | 0.3 | 0.7 | 19.8 | 20.3 |
FDP | 2023-02-17 | 0.3 | 0.7 | 20.0 | 20.4 |
FDP | 2023-02-16 | 0.3 | 0.7 | 19.5 | 20.1 |
FDP Growth Metrics
- Its 5 year net income to common stockholders growth rate is now at -77.13%.
- The year over year net cashflow from operations growth rate now stands at -63.85%.
- Its 3 year net income to common stockholders growth rate is now at 331.14%.

The table below shows FDP's growth in key financial areas (numbers in millions of US dollars).
Date | Revenue | Operating Cash Flow | Net Income to Common Stock |
---|---|---|---|
2022-12-31 | 4,442.3 | 61.8 | 98.6 |
2022-09-30 | 4,419.7 | 82.6 | 69.1 |
2022-06-30 | 4,371 | 84.1 | 37.1 |
2022-03-31 | 4,300.7 | 81.4 | 63.1 |
2021-12-31 | 4,252 | 128.5 | 80 |
2021-09-30 | 4,237 | 158.3 | 92.1 |
FDP's Quality Factors
The “Quality” component of the POWR Ratings focuses on 31 different factors of a companies fundamentals and operational strength. Here are some key insights as we drill into the specifics of these quality attributes.- FDP has a Quality Grade of C, ranking ahead of 56.48% of graded US stocks.
- FDP's asset turnover comes in at 1.253 -- ranking 3rd of 16 Agriculture stocks.
- SITE, SISI, and CVGW are the stocks whose asset turnover ratios are most correlated with FDP.
The table below shows FDP's key quality metrics over time.
Period | Asset Turnover | Gross Margin | ROIC |
---|---|---|---|
2021-10-01 | 1.253 | 0.071 | 0.041 |
2021-07-02 | 1.258 | 0.075 | 0.051 |
2021-04-02 | 1.251 | 0.069 | 0.041 |
2021-01-01 | 1.262 | 0.060 | 0.026 |
2020-09-25 | 1.269 | 0.059 | 0.019 |
2020-06-26 | 1.287 | 0.060 | 0.019 |
FDP Price Target
For more insight on analysts targets of FDP, see our FDP price target page. And for a list of of all stocks sorted by upside potential based on analyst target price, see our Top Price Target page.
Average Price Target | $38.33 | Average Broker Recommendation | 1.5 (Moderate Buy) |
FDP Stock Price Chart Interactive Chart >
FDP Price/Volume Stats
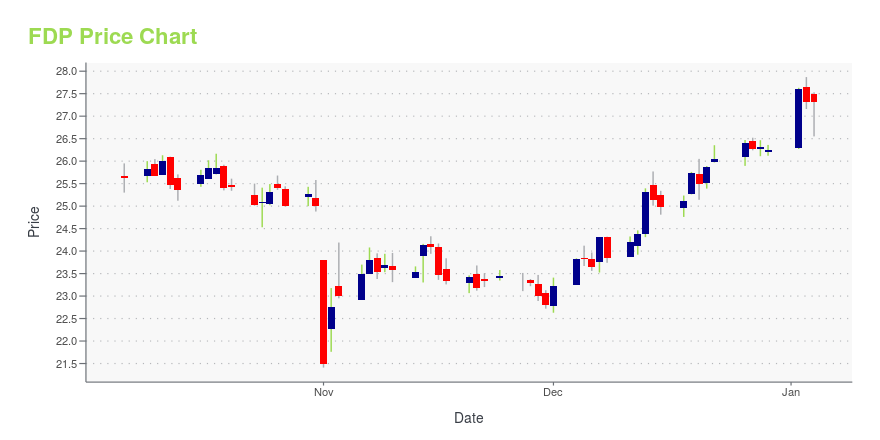
Current price | $29.80 | 52-week high | $32.49 |
Prev. close | $29.10 | 52-week low | $22.63 |
Day low | $28.94 | Volume | 121,200 |
Day high | $29.89 | Avg. volume | 179,970 |
50-day MA | $29.26 | Dividend yield | 2.04% |
200-day MA | $27.50 | Market Cap | 1.43B |
Fresh Del Monte Produce, Inc. (FDP) Company Bio
Fresh Del Monte Produce is one of the world's leading vertically integrated producers, marketers and distributors of high-quality fresh and fresh-cut fruit and vegetables, as well as a leading producer and distributor of prepared food in Europe, Africa, the Middle East and the countries formerly part of the Soviet Union. The company was founded in 1886 and is based in Coral Gables, Florida.
Latest FDP News From Around the Web
Below are the latest news stories about FRESH DEL MONTE PRODUCE INC that investors may wish to consider to help them evaluate FDP as an investment opportunity.
Do These 3 Checks Before Buying Fresh Del Monte Produce Inc. (NYSE:FDP) For Its Upcoming DividendIt looks like Fresh Del Monte Produce Inc. ( NYSE:FDP ) is about to go ex-dividend in the next four days. The... |
Fresh Del Monte Produce's (NYSE:FDP) Dividend Will Be $0.15Fresh Del Monte Produce Inc. ( NYSE:FDP ) has announced that it will pay a dividend of $0.15 per share on the 31st of... |
Fresh Del Monte Produce Inc. (NYSE:FDP) Q4 2022 Earnings Call TranscriptFresh Del Monte Produce Inc. (NYSE:FDP) Q4 2022 Earnings Call Transcript February 22, 2023 Operator: Good day everyone and welcome to Fresh Del Monte Produce’s Fourth Quarter and Full Fiscal Year 2022 Conference Call. Today’s conference call is being broadcast live over the Internet and is also being recorded for playback purposes. For opening remarks […] |
Here's Why We Think Fresh Del Monte Produce (NYSE:FDP) Is Well Worth WatchingInvestors are often guided by the idea of discovering 'the next big thing', even if that means buying 'story stocks... |
Fresh Del Monte Produce Q4 Earnings Top EstimatesFresh Del Monte Produce Inc (NYSE: FDP) reported fourth-quarter FY22 sales growth of 2% year-on-year to $1.04 billion, beating the consensus of $1.03 billion. The company said inflation-justified per unit price increase drove its sales growth. Gross profit jumped 105.3% Y/Y to $81.7 million, and the profit margin expanded 390 basis points to 7.8%. The operating margin was 3%, and operating income for the quarter was $31.2 million versus an operating loss of $(9.2) million. Adjusted EBITDA of $58 |
FDP Price Returns
1-mo | -4.95% |
3-mo | 14.59% |
6-mo | 23.38% |
1-year | 18.32% |
3-year | -9.02% |
5-year | -28.46% |
YTD | 14.33% |
2022 | -2.98% |
2021 | 16.50% |
2020 | -30.34% |
2019 | 24.32% |
2018 | -39.80% |
FDP Dividends
Ex-Dividend Date | Type | Payout Amount | Change | ||||||
---|---|---|---|---|---|---|---|---|---|
Loading, please wait... |
Continue Researching FDP
Want to see what other sources are saying about Fresh Del Monte Produce Inc's financials and stock price? Try the links below:Fresh Del Monte Produce Inc (FDP) Stock Price | Nasdaq
Fresh Del Monte Produce Inc (FDP) Stock Quote, History and News - Yahoo Finance
Fresh Del Monte Produce Inc (FDP) Stock Price and Basic Information | MarketWatch
Loading social stream, please wait...