
FedEx Corp. (FDX): Price and Financial Metrics
FDX Price/Volume Stats
| Current price | $300.14 | 52-week high | $313.84 |
| Prev. close | $298.59 | 52-week low | $224.69 |
| Day low | $297.47 | Volume | 1,200,800 |
| Day high | $302.18 | Avg. volume | 1,914,961 |
| 50-day MA | $272.78 | Dividend yield | 1.84% |
| 200-day MA | $259.49 | Market Cap | 73.86B |
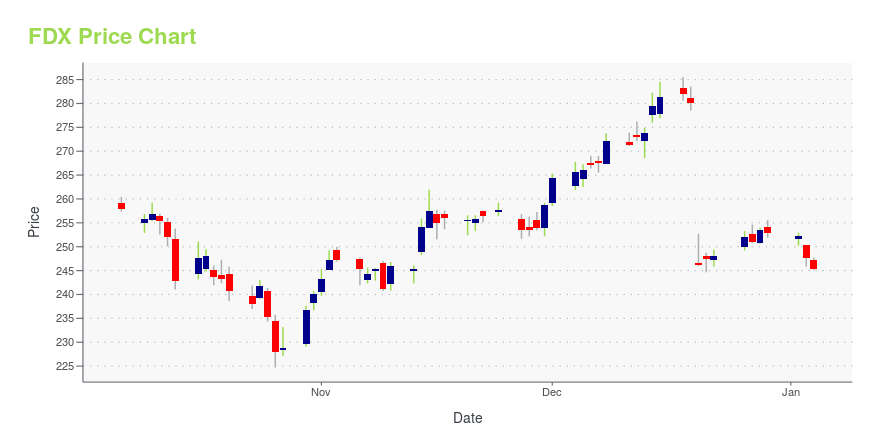
FDX Stock Price Chart Interactive Chart >
FedEx Corp. (FDX) Company Bio
FedEx Corporation, formerly Federal Express Corporation and later FDX Corporation, is an American multinational conglomerate holding company which focuses on transportation, e-commerce and business services which is headquartered in Memphis, Tennessee. The name "FedEx" is a syllabic abbreviation of the name of the company's original air division, Federal Express, which was used from 1973 until 2000. FedEx today is best known for its air delivery service, FedEx Express, which was one of the first major shipping companies to offer overnight delivery as a flagship service. Since then, FedEx also started FedEx Ground, FedEx Office (originally known as Kinko's), FedEx Supply Chain, FedEx Freight, and various other services across multiple subsidiaries, often meant to respond to its main competitor, UPS. FedEx is also one of the top contractors of the US government and assists in the transport of some United States Postal Service packages through its service FedEx SmartPost. (Source:Wikipedia)
Latest FDX News From Around the Web
Below are the latest news stories about FEDEX CORP that investors may wish to consider to help them evaluate FDX as an investment opportunity.
AI and Automation Leaders for 2024: 7 Stocks to Stay Ahead of the Robot UprisingIt’s time for investors to ditch the search for the mythical crystal ball and instead embrace the algorithms when deciphering the best AI stock for your needs. |
Minted customers complain the venture-backed card company messed up their holidays with botched ship dates and misprinted addressesAngry Minted customers say they couldn’t track their missing orders, and cards that did arrive had errors. |
Is the Next Shoe About to Drop for FedEx?Shares of FedEx gapped lower earlier this month and have tested the rising 200-day moving average line. Trading volume was heavy on the gap lower but has returned to more "normal" levels in recent days. If traders were using a test of the 200-day line as a buy signal I would have assumed that we would be seeing more trading volume as traders voted with their feet. |
Disaster Preparedness Exercises Bring Big Wins to Small CommunitiesBy Thomas Brown Originally published by Team Rubicon NORTHAMPTON, MA / ACCESSWIRE / December 28, 2023 / New no-cost trainings are bolstering disaster management capabilities within at-risk communities and providing them the ability to plan for future ... |
Air cargo industry faced stress test in 20232023 was a tumultuous year for airfreight. The downturn in business put pressure on the industry, but the year ended with some optimism. The post Air cargo industry faced stress test in 2023 appeared first on FreightWaves. |
FDX Price Returns
| 1-mo | 1.33% |
| 3-mo | 13.52% |
| 6-mo | 20.58% |
| 1-year | 15.40% |
| 3-year | 12.52% |
| 5-year | 86.97% |
| YTD | 19.90% |
| 2023 | 49.13% |
| 2022 | -31.64% |
| 2021 | 0.72% |
| 2020 | 74.27% |
| 2019 | -4.78% |
FDX Dividends
| Ex-Dividend Date | Type | Payout Amount | Change | ||||||
|---|---|---|---|---|---|---|---|---|---|
| Loading, please wait... | |||||||||
Continue Researching FDX
Here are a few links from around the web to help you further your research on Fedex Corp's stock as an investment opportunity:Fedex Corp (FDX) Stock Price | Nasdaq
Fedex Corp (FDX) Stock Quote, History and News - Yahoo Finance
Fedex Corp (FDX) Stock Price and Basic Information | MarketWatch
Loading social stream, please wait...