
Fennec Pharmaceuticals Inc. (FENC): Price and Financial Metrics
FENC Price/Volume Stats
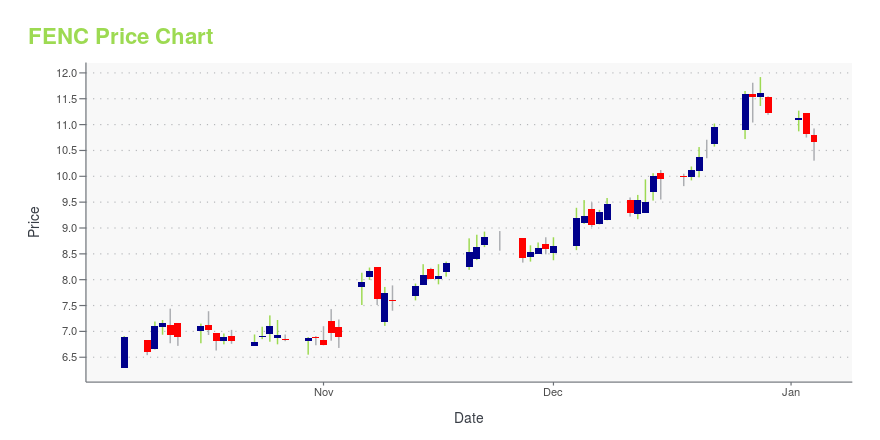
| Current price | $6.51 | 52-week high | $11.92 |
| Prev. close | $6.61 | 52-week low | $5.66 |
| Day low | $6.46 | Volume | 98,170 |
| Day high | $6.70 | Avg. volume | 125,775 |
| 50-day MA | $6.61 | Dividend yield | N/A |
| 200-day MA | $8.69 | Market Cap | 177.91M |
FENC Stock Price Chart Interactive Chart >
Fennec Pharmaceuticals Inc. (FENC) Company Bio
Fennec Pharmaceuticals Inc., a biopharmaceutical company, develops product candidates for use in the treatment of cancer in the United States. Its lead product candidate is the Sodium Thiosulfate, a water soluble thiol compound that acts as a chemical reducing agent, which has completed the Phase III clinical trial for the prevention of cisplatin induced hearing loss or ototoxicity in children. The company was founded in 1996 and is based in Research Triangle Park, North Carolina.
Latest FENC News From Around the Web
Below are the latest news stories about FENNEC PHARMACEUTICALS INC that investors may wish to consider to help them evaluate FENC as an investment opportunity.
With 31% stake, Fennec Pharmaceuticals Inc. (NASDAQ:FENC) seems to have captured hedge funds investors' interestKey Insights Institutions' substantial holdings in Fennec Pharmaceuticals implies that they have significant influence... |
Fennec Announces Incremental $5 Million Investment from Petrichor~ Supports Strategic Discussions and Global Launch Activities ~ ~ Extends Access to Additional Undrawn Capital As Needed During Global PEDMARK® Rollout ~ ~ Facilitates Market Expansion into the Adolescent and Young Adult (AYA) Patient Population ~ RESEARCH TRIANGLE PARK, N.C., Dec. 05, 2023 (GLOBE NEWSWIRE) -- Fennec Pharmaceuticals Inc. (NASDAQ: FENC; TSX: FRX), a commercial stage specialty pharmaceutical company focused on improving the lives of children with cancer, today announced the third |
Fennec Pharmaceuticals to Participate in Upcoming Investor ConferencesRESEARCH TRIANGLE PARK, N.C., Nov. 09, 2023 (GLOBE NEWSWIRE) -- Fennec Pharmaceuticals Inc. (NASDAQ:FENC; TSX: FRX), a commercial stage specialty pharmaceutical company, today announced that the Company will be participating in upcoming conferences. The management team will also host one-on-one investor meetings at the conferences. Presentation Details: Event: Jefferies London Healthcare Conference in London, UKDate: November 16, 2023Time: Company Presentation at 5:00 a.m. ET / 10:00 a.m. GMT Ev |
Fennec Pharmaceuticals Inc. (NASDAQ:FENC) Reported Earnings Last Week And Analysts Are Already Upgrading Their EstimatesA week ago, Fennec Pharmaceuticals Inc. ( NASDAQ:FENC ) came out with a strong set of quarterly numbers that could... |
Fennec Pharmaceuticals Inc. (NASDAQ:FENC) Q3 2023 Earnings Call TranscriptFennec Pharmaceuticals Inc. (NASDAQ:FENC) Q3 2023 Earnings Call Transcript November 6, 2023 Fennec Pharmaceuticals Inc. beats earnings expectations. Reported EPS is $-0.07, expectations were $-0.11. Operator: Good morning, ladies and gentlemen, and welcome to Fennec Pharmaceuticals Third Quarter 2023 Earnings and Corporate Update Conference Call. At this time, all participants are in a listen-only mode. […] |
FENC Price Returns
| 1-mo | 8.14% |
| 3-mo | -29.32% |
| 6-mo | -34.24% |
| 1-year | -19.13% |
| 3-year | 96.68% |
| 5-year | 222.28% |
| YTD | -41.98% |
| 2023 | 16.88% |
| 2022 | 118.18% |
| 2021 | 18.12% |
| 2020 | 14.79% |
| 2019 | 1.72% |
Loading social stream, please wait...