FibroGen, Inc (FGEN): Price and Financial Metrics
GET POWR RATINGS... FREE!
FGEN POWR Grades
- FGEN scores best on the Sentiment dimension, with a Sentiment rank ahead of 82.14% of US stocks.
- FGEN's strongest trending metric is Value; it's been moving down over the last 178 days.
- FGEN ranks lowest in Stability; there it ranks in the 6th percentile.
FGEN Stock Summary
- The capital turnover (annual revenue relative to shareholder's equity) for FGEN is -6.56 -- better than merely 2.42% of US stocks.
- FGEN's price/sales ratio is 13.38; that's higher than the P/S ratio of 92.48% of US stocks.
- As for revenue growth, note that FGEN's revenue has grown -40.19% over the past 12 months; that beats the revenue growth of just 5.06% of US companies in our set.
- Stocks with similar financial metrics, market capitalization, and price volatility to FIBROGEN INC are WVE, ONCT, PLRX, FDMT, and CYCN.
- FGEN's SEC filings can be seen here. And to visit FIBROGEN INC's official web site, go to www.fibrogen.com.
FGEN Valuation Summary
- FGEN's price/sales ratio is 13.4; this is 605.26% higher than that of the median Healthcare stock.
- Over the past 102 months, FGEN's price/earnings ratio has gone up 27.9.
Below are key valuation metrics over time for FGEN.
Stock | Date | P/S | P/B | P/E | EV/EBIT |
---|---|---|---|---|---|
FGEN | 2023-03-17 | 13.4 | -87.8 | -6.4 | -6.4 |
FGEN | 2023-03-16 | 13.5 | -88.7 | -6.5 | -6.5 |
FGEN | 2023-03-15 | 13.4 | -87.8 | -6.4 | -6.4 |
FGEN | 2023-03-14 | 13.4 | -88.1 | -6.4 | -6.4 |
FGEN | 2023-03-13 | 13.4 | -87.9 | -6.4 | -6.4 |
FGEN | 2023-03-10 | 13.5 | -88.4 | -6.5 | -6.4 |
FGEN Growth Metrics
- The 2 year price growth rate now stands at -78.2%.
- The 4 year net cashflow from operations growth rate now stands at -5702.49%.
- Its 3 year cash and equivalents growth rate is now at 127.61%.

The table below shows FGEN's growth in key financial areas (numbers in millions of US dollars).
Date | Revenue | Operating Cash Flow | Net Income to Common Stock |
---|---|---|---|
2022-09-30 | 122.911 | -148.38 | -361.557 |
2022-06-30 | 263.149 | -52.245 | -220.109 |
2022-03-31 | 257.707 | -45.724 | -281.473 |
2021-12-31 | 235.309 | -82.232 | -290.023 |
2021-12-31 | 235.309 | -82.232 | -290.023 |
2021-09-30 | 283.765 | -34.5 | -214.579 |
FGEN's Quality Factors
The “Quality” component of the POWR Ratings focuses on 31 different factors of a companies fundamentals and operational strength. Here are some key insights as we drill into the specifics of these quality attributes.- FGEN has a Quality Grade of B, ranking ahead of 75.49% of graded US stocks.
- FGEN's asset turnover comes in at 0.212 -- ranking 192nd of 681 Pharmaceutical Products stocks.
- CKPT, ARWR, and IBIO are the stocks whose asset turnover ratios are most correlated with FGEN.
The table below shows FGEN's key quality metrics over time.
Period | Asset Turnover | Gross Margin | ROIC |
---|---|---|---|
2021-06-30 | 0.212 | 0.934 | -1.182 |
2021-03-31 | 0.235 | 0.941 | -0.907 |
2020-12-31 | 0.216 | 0.950 | -0.594 |
2020-09-30 | 0.145 | 0.940 | -0.473 |
2020-06-30 | 0.128 | 0.952 | -0.520 |
2020-03-31 | 0.295 | 0.992 | -0.151 |
FGEN Price Target
For more insight on analysts targets of FGEN, see our FGEN price target page. And for a list of of all stocks sorted by upside potential based on analyst target price, see our Top Price Target page.
Average Price Target | $24.71 | Average Broker Recommendation | 1.9 (Hold) |
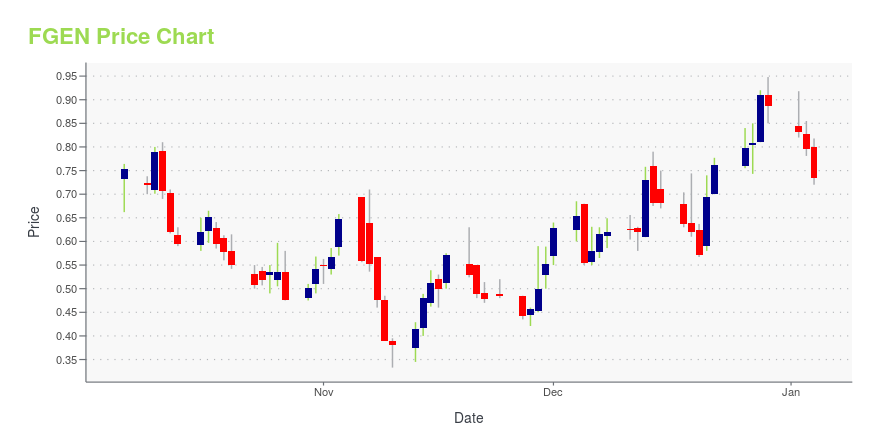
FGEN Stock Price Chart Interactive Chart >
FGEN Price/Volume Stats
Current price | $20.00 | 52-week high | $25.69 |
Prev. close | $20.00 | 52-week low | $7.81 |
Day low | $19.72 | Volume | 932,051 |
Day high | $20.10 | Avg. volume | 997,381 |
50-day MA | $21.86 | Dividend yield | N/A |
200-day MA | $15.69 | Market Cap | 1.88B |
FibroGen, Inc (FGEN) Company Bio
Fibrogen is a research-based biopharmaceutical company focused on the discovery, development and commercialization of novel therapeutics to treat serious unmet medical needs. The company was incorporated in 1993 and is based in San Francisco, California.
Latest FGEN News From Around the Web
Below are the latest news stories about FIBROGEN INC that investors may wish to consider to help them evaluate FGEN as an investment opportunity.
FibroGen, Inc. (NASDAQ:FGEN) Q4 2022 Earnings Call TranscriptFibroGen, Inc. (NASDAQ:FGEN) Q4 2022 Earnings Call Transcript February 27, 2023 Operator: Thank you for standing by, and welcome to FibroGen’s Fourth Quarter and Full Year 2022 Financial Results Earnings Call. . I would now like to hand the call over to your host, Mike Tung. Please go ahead. Michael Tung: Thank you, Latif, and […] |
Q4 2022 FibroGen Inc Earnings CallQ4 2022 FibroGen Inc Earnings Call |
FibroGen (FGEN) Reports Q4 Loss, Tops Revenue EstimatesFibroGen (FGEN) delivered earnings and revenue surprises of 26.32% and 43.89%, respectively, for the quarter ended December 2022. Do the numbers hold clues to what lies ahead for the stock? |
FibroGen Reports Fourth Quarter and Full Year 2022 Financial ResultsTopline Data from Five Pivotal Phase 3 Trials in 2023Total Company Revenue $140.7 Million in 2022Continued Strong Roxadustat Volume Growth in China SAN FRANCISCO, Feb. 27, 2023 (GLOBE NEWSWIRE) -- FibroGen, Inc. (NASDAQ: FGEN) today reported financial results for the fourth quarter and full year 2022 and provided an update on the company’s recent developments. “We are proud of the significant progress advancing our clinical pipeline in 2022 and excited and well-prepared to deliver results from f |
FibroGen to Present at Cowen’s 43rd Annual Health Care ConferenceSAN FRANCISCO, Feb. 27, 2023 (GLOBE NEWSWIRE) -- FibroGen, Inc. (NASDAQ: FGEN) today announced that Mark Eisner, M.D., M.P.H., Chief Medical Officer, will participate in a panel discussion at Cowen’s 43rd Annual Health Care Conference to be held in Boston on March 5 - 8, 2023. Details of the presentations are as follows: Panel Information:Date: Wednesday, March 8, 2023Panel topic: Respiratory/Infections Time: 10:30 AM Eastern Time A live audio webcast of the event will be available to investors |
FGEN Price Returns
1-mo | -16.00% |
3-mo | 39.18% |
6-mo | 65.15% |
1-year | 48.26% |
3-year | -19.58% |
5-year | -60.82% |
YTD | 24.84% |
2022 | 13.62% |
2021 | -61.98% |
2020 | -13.52% |
2019 | -7.32% |
2018 | -2.36% |
Continue Researching FGEN
Here are a few links from around the web to help you further your research on Fibrogen Inc's stock as an investment opportunity:Fibrogen Inc (FGEN) Stock Price | Nasdaq
Fibrogen Inc (FGEN) Stock Quote, History and News - Yahoo Finance
Fibrogen Inc (FGEN) Stock Price and Basic Information | MarketWatch
Loading social stream, please wait...