Federated Hermes (FHI): Price and Financial Metrics
GET POWR RATINGS... FREE!
FHI POWR Grades
- FHI scores best on the Momentum dimension, with a Momentum rank ahead of 94.51% of US stocks.
- FHI's strongest trending metric is Sentiment; it's been moving up over the last 177 days.
- FHI ranks lowest in Growth; there it ranks in the 40th percentile.
FHI Stock Summary
- Of note is the ratio of FEDERATED HERMES INC's sales and general administrative expense to its total operating expenses; 80.04% of US stocks have a lower such ratio.
- With a year-over-year growth in debt of 120.34%, FEDERATED HERMES INC's debt growth rate surpasses 89.55% of about US stocks.
- In terms of volatility of its share price, FHI is more volatile than just 17.16% of stocks we're observing.
- If you're looking for stocks that are quantitatively similar to FEDERATED HERMES INC, a group of peers worth examining would be ROCK, RAVE, WTS, FCN, and THR.
- Visit FHI's SEC page to see the company's official filings. To visit the company's web site, go to www.federatedinvestors.com.
FHI Valuation Summary
- FHI's price/earnings ratio is 13.5; this is 18.42% higher than that of the median Financial Services stock.
- FHI's price/sales ratio has moved down 1.6 over the prior 243 months.
Below are key valuation metrics over time for FHI.
Stock | Date | P/S | P/B | P/E | EV/EBIT |
---|---|---|---|---|---|
FHI | 2023-01-23 | 2.4 | 3.5 | 13.5 | 10.6 |
FHI | 2023-01-20 | 2.4 | 3.5 | 13.5 | 10.6 |
FHI | 2023-01-19 | 2.4 | 3.5 | 13.5 | 10.6 |
FHI | 2023-01-18 | 2.5 | 3.5 | 13.6 | 10.7 |
FHI | 2023-01-17 | 2.5 | 3.5 | 13.6 | 10.7 |
FHI | 2023-01-13 | 2.5 | 3.6 | 13.9 | 10.9 |
FHI Growth Metrics
- Its 2 year net income to common stockholders growth rate is now at -10.75%.
- Its 5 year cash and equivalents growth rate is now at 225.85%.
- Its 3 year price growth rate is now at -6.95%.

The table below shows FHI's growth in key financial areas (numbers in millions of US dollars).
Date | Revenue | Operating Cash Flow | Net Income to Common Stock |
---|---|---|---|
2022-09-30 | 1,393.56 | 260.962 | 251.562 |
2022-06-30 | 1,339.006 | 194.948 | 253.445 |
2022-03-31 | 1,284.038 | 181.149 | 251.672 |
2021-12-31 | 1,300.447 | 170.383 | 270.293 |
2021-09-30 | 1,342.72 | 230.739 | 296.898 |
2021-06-30 | 1,380.586 | 274.795 | 311.358 |
FHI's Quality Factors
The “Quality” component of the POWR Ratings focuses on 31 different factors of a companies fundamentals and operational strength. Here are some key insights as we drill into the specifics of these quality attributes.- FHI has a Quality Grade of B, ranking ahead of 83.51% of graded US stocks.
- FHI's asset turnover comes in at 0.68 -- ranking 28th of 442 Trading stocks.
- GMRE, BLK, and HLNE are the stocks whose asset turnover ratios are most correlated with FHI.
The table below shows FHI's key quality metrics over time.
Period | Asset Turnover | Gross Margin | ROIC |
---|---|---|---|
2021-06-30 | 0.680 | 1 | 0.951 |
2021-03-31 | 0.714 | 1 | 1.058 |
2020-12-31 | 0.731 | 1 | 1.035 |
2020-09-30 | 0.745 | 1 | 1.016 |
2020-06-30 | 0.757 | 1 | 0.924 |
2020-03-31 | 0.761 | 1 | 0.828 |
FHI Price Target
For more insight on analysts targets of FHI, see our FHI price target page. And for a list of of all stocks sorted by upside potential based on analyst target price, see our Top Price Target page.
Average Price Target | $34.29 | Average Broker Recommendation | 2 (Hold) |
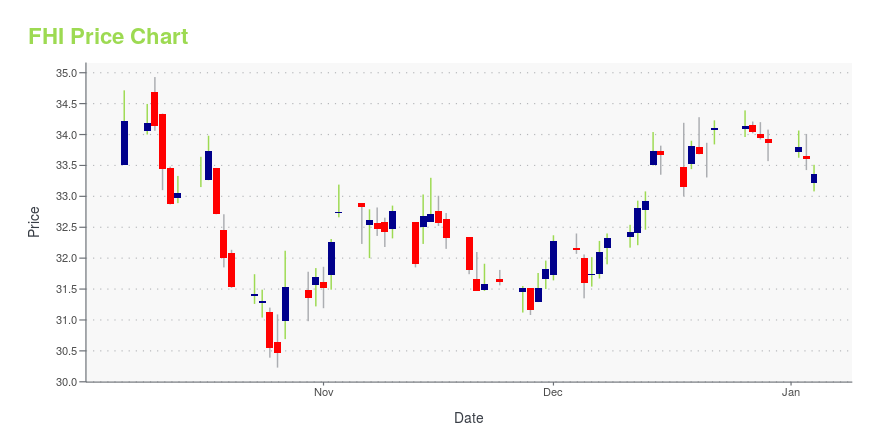
FHI Stock Price Chart Interactive Chart >
FHI Price/Volume Stats
Current price | $38.43 | 52-week high | $39.48 |
Prev. close | $38.68 | 52-week low | $27.88 |
Day low | $38.25 | Volume | 655,100 |
Day high | $39.36 | Avg. volume | 667,589 |
50-day MA | $37.30 | Dividend yield | 2.81% |
200-day MA | $34.10 | Market Cap | 3.42B |
Federated Hermes (FHI) Company Bio
Federated Hermes (formerly Federated Investors) provides its services to individuals, including high net worth individuals, banking or thrift institutions, investment companies, pension and profit sharing plans, pooled investment vehicles, charitable organizations, state or municipal government entities, and registered investment advisors. Through its subsidiaries, it manages separate client-focused equity, fixed income, and money market mutual funds and separate client-focused equity, fixed income, and balanced portfolios. The company was founded in 1955 and is based in Pittsburgh, Pennsylvania.
Latest FHI News From Around the Web
Below are the latest news stories about FEDERATED HERMES INC that investors may wish to consider to help them evaluate FHI as an investment opportunity.
Franklin Resources (BEN) Expected to Beat Earnings Estimates: Can the Stock Move Higher?Franklin Resources (BEN) possesses the right combination of the two key ingredients for a likely earnings beat in its upcoming report. Get prepared with the key expectations. |
Federated Hermes (FHI) Reports Next Week: Wall Street Expects Earnings GrowthFederated Hermes (FHI) possesses the right combination of the two key ingredients for a likely earnings beat in its upcoming report. Get prepared with the key expectations. |
Month-end portfolio data now available for Federated Hermes Premier Municipal Income FundFederated Hermes, Inc. (NYSE: FHI), a global leader in active, responsible investing, today announced that monthly fund composition and performance data for Federated Hermes Premier Municipal Income Fund (NYSE: FMN) as of Dec. 31, 2022, is now available in the Products section of FederatedInvestors.com. To order hard copies of this data or to be placed on a mailing list, call 800-245-0242 x5587538, email [email protected] or write to Federated Hermes, 1001 Liberty Avenue, Floor 23, Pittsbu |
Why Federated Hermes (FHI) Could Beat Earnings Estimates AgainFederated Hermes (FHI) has an impressive earnings surprise history and currently possesses the right combination of the two key ingredients for a likely beat in its next quarterly report. |
Federated Hermes Premier Municipal Income Fund declares dividendFederated Hermes Premier Municipal Income Fund (NYSE: FMN) has declared a dividend. The fund seeks to provide investors with current dividend income that is exempt from regular federal income tax. In addition, this fund features income exempt from the federal alternative minimum tax (AMT). |
FHI Price Returns
1-mo | 5.84% |
3-mo | 11.92% |
6-mo | 14.20% |
1-year | 19.94% |
3-year | 23.17% |
5-year | 34.61% |
YTD | 5.84% |
2022 | -0.16% |
2021 | 34.68% |
2020 | -3.79% |
2019 | 27.07% |
2018 | -23.34% |
FHI Dividends
Ex-Dividend Date | Type | Payout Amount | Change | ||||||
---|---|---|---|---|---|---|---|---|---|
Loading, please wait... |
Loading social stream, please wait...