
Frank's International N.V. (FI): Price and Financial Metrics
FI Price/Volume Stats
| Current price | $159.94 | 52-week high | $162.47 |
| Prev. close | $156.01 | 52-week low | $109.11 |
| Day low | $156.89 | Volume | 3,345,300 |
| Day high | $160.16 | Avg. volume | 2,527,922 |
| 50-day MA | $151.53 | Dividend yield | N/A |
| 200-day MA | $142.01 | Market Cap | 93.58B |
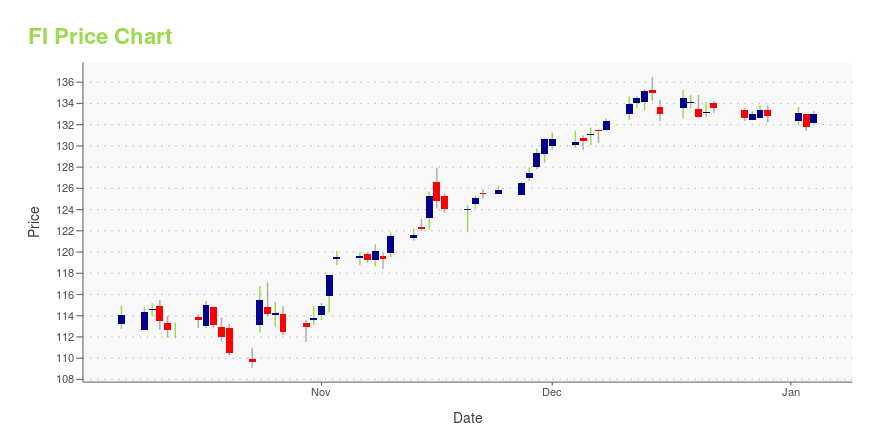
FI Stock Price Chart Interactive Chart >
Frank's International N.V. (FI) Company Bio
Frank's International NV provides various engineered tubular services for the oil and gas exploration and production companies in the United States and internationally. The company was founded in 1938 and is based in Amsterdam, the Netherlands.
Latest FI News From Around the Web
Below are the latest news stories about FISERV INC that investors may wish to consider to help them evaluate FI as an investment opportunity.
Fiserv Inc CFO Robert Hau Sells 188,088 SharesRobert Hau, Chief Financial Officer of Fiserv Inc, executed a sale of 188,088 shares in the company on December 26, 2023, according to a recent SEC Filing. |
First Solar to sell up to $700 million in IRA tax credits to FiservSolar panel manufacturer First Solar said on Wednesday it plans to sell up to $700 million in tax credits it accumulated through the sale of photovoltaic (PV) solar modules this year to payments firm Fiserv. First Solar is one of the companies eligible for the tax credits for producing clean energy components under the new guidelines for the Inflation Reduction Act (IRA). 45X credits, also known as Advanced Manufacturing Production tax credits, are offered for each product manufactured domestically in the U.S. to incentivize the transition to cleaner energy and reduce the reliance on Chinese-made components. |
Why These 7 Fintech Stocks Should Be on Your Radar in 2024Consider adding these seven fintech stocks to your watchlist, as each one is poised to profit from the "future of finance" trend. |
Altigen Communications, Inc. (PNK:ATGN) Q4 2023 Earnings Call TranscriptAltigen Communications, Inc. (PNK:ATGN) Q4 2023 Earnings Call Transcript December 14, 2023 Operator: Greetings. Welcome to the Altigen Communications Fourth Quarter and Fiscal Year 2023 Results Conference Call. At this time, all participants are in a listen-only mode. A question-and-answer session will follow the formal presentation. [Operator Instructions] Please note, this conference is being recorded. […] |
Q4 2023 Altigen Communications Inc Earnings CallQ4 2023 Altigen Communications Inc Earnings Call |
FI Price Returns
| 1-mo | 6.80% |
| 3-mo | 2.60% |
| 6-mo | 13.16% |
| 1-year | 29.50% |
| 3-year | 39.47% |
| 5-year | 56.34% |
| YTD | 20.40% |
| 2023 | 31.43% |
| 2022 | -2.62% |
| 2021 | -8.84% |
| 2020 | -1.53% |
| 2019 | 57.34% |
Continue Researching FI
Want to see what other sources are saying about Frank'S International Nv's financials and stock price? Try the links below:Frank'S International Nv (FI) Stock Price | Nasdaq
Frank'S International Nv (FI) Stock Quote, History and News - Yahoo Finance
Frank'S International Nv (FI) Stock Price and Basic Information | MarketWatch
Loading social stream, please wait...