National Beverage Corp. (FIZZ): Price and Financial Metrics
FIZZ Price/Volume Stats
Current price | $47.36 | 52-week high | $55.12 |
Prev. close | $46.87 | 52-week low | $43.74 |
Day low | $46.79 | Volume | 44,404 |
Day high | $47.75 | Avg. volume | 155,218 |
50-day MA | $48.55 | Dividend yield | N/A |
200-day MA | $49.06 | Market Cap | 4.43B |
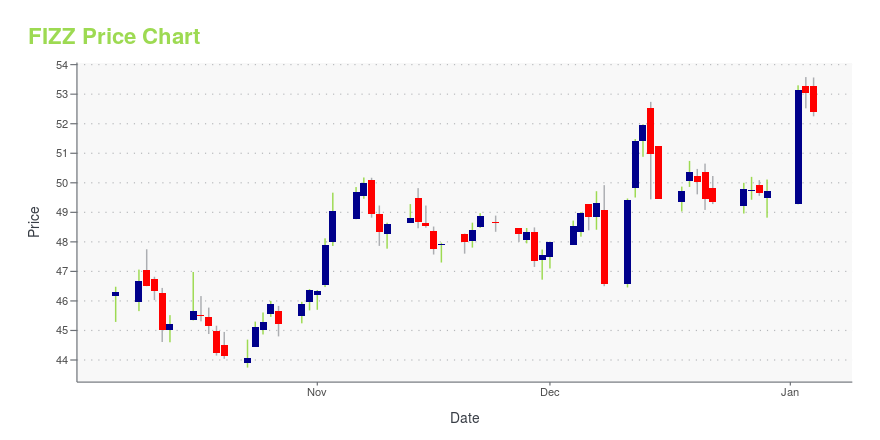
FIZZ Stock Price Chart Interactive Chart >
FIZZ POWR Grades
- FIZZ scores best on the Quality dimension, with a Quality rank ahead of 97.92% of US stocks.
- FIZZ's strongest trending metric is Growth; it's been moving down over the last 26 weeks.
- FIZZ's current lowest rank is in the Value metric (where it is better than 7.86% of US stocks).
FIZZ Stock Summary
- Price to trailing twelve month operating cash flow for FIZZ is currently 27.29, higher than 84.5% of US stocks with positive operating cash flow.
- Of note is the ratio of NATIONAL BEVERAGE CORP's sales and general administrative expense to its total operating expenses; 87.34% of US stocks have a lower such ratio.
- The volatility of NATIONAL BEVERAGE CORP's share price is greater than that of merely 5.44% US stocks with at least 200 days of trading history.
- If you're looking for stocks that are quantitatively similar to NATIONAL BEVERAGE CORP, a group of peers worth examining would be TR, JJSF, IPAR, AIT, and KELYA.
- Visit FIZZ's SEC page to see the company's official filings. To visit the company's web site, go to www.nationalbeverage.com.
FIZZ Valuation Summary
- FIZZ's price/sales ratio is 3.9; this is 105.26% higher than that of the median Consumer Defensive stock.
- Over the past 243 months, FIZZ's EV/EBIT ratio has gone up 12.5.
Below are key valuation metrics over time for FIZZ.
Stock | Date | P/S | P/B | P/E | EV/EBIT |
---|---|---|---|---|---|
FIZZ | 2023-12-22 | 3.9 | 9.9 | 28.1 | 20.5 |
FIZZ | 2023-12-21 | 3.9 | 9.9 | 28.1 | 20.5 |
FIZZ | 2023-12-20 | 4.0 | 10.0 | 28.5 | 20.8 |
FIZZ | 2023-12-19 | 4.0 | 10.1 | 28.7 | 20.9 |
FIZZ | 2023-12-18 | 3.9 | 9.9 | 28.3 | 20.6 |
FIZZ | 2023-12-15 | 3.9 | 9.9 | 28.2 | 20.5 |
FIZZ Growth Metrics
- The 5 year net income to common stockholders growth rate now stands at 21.42%.
- The year over year cash and equivalents growth rate now stands at -75.18%.
- Its 5 year net cashflow from operations growth rate is now at 56.18%.
The table below shows FIZZ's growth in key financial areas (numbers in millions of US dollars).
Date | Revenue | Operating Cash Flow | Net Income to Common Stock |
---|---|---|---|
2022-09-30 | 1,160.893 | 129.407 | 136.912 |
2022-06-30 | 1,144.418 | 117.092 | 140.15 |
2022-03-31 | 1,138.013 | 133.133 | 158.512 |
2021-12-31 | 1,114.896 | 141.151 | 163.299 |
2021-09-30 | 1,101.904 | 168.857 | 168.918 |
2021-06-30 | 1,090.555 | 198.899 | 176.798 |
FIZZ's Quality Factors
The “Quality” component of the POWR Ratings focuses on 31 different factors of a companies fundamentals and operational strength. Here are some key insights as we drill into the specifics of these quality attributes.- FIZZ has a Quality Grade of A, ranking ahead of 98.05% of graded US stocks.
- FIZZ's asset turnover comes in at 1.804 -- ranking 2nd of 6 Candy & Soda stocks.
- MNST, REED, and COKE are the stocks whose asset turnover ratios are most correlated with FIZZ.
The table below shows FIZZ's key quality metrics over time.
Period | Asset Turnover | Gross Margin | ROIC |
---|---|---|---|
2021-07-31 | 1.804 | 0.394 | 0.965 |
2021-05-01 | 1.704 | 0.393 | 0.950 |
2021-01-30 | 1.646 | 0.391 | 0.941 |
2020-10-31 | 1.556 | 0.387 | 0.871 |
2020-08-01 | 1.638 | 0.379 | 0.773 |
2020-05-02 | 1.699 | 0.370 | 0.668 |
FIZZ Price Target
For more insight on analysts targets of FIZZ, see our FIZZ price target page. And for a list of of all stocks sorted by upside potential based on analyst target price, see our Top Price Target page.
Average Price Target | $43.67 | Average Broker Recommendation | 2.5 (Moderate Sell) |
National Beverage Corp. (FIZZ) Company Bio
National Beverage Corporation develops, produces, markets, and sells a portfolio of flavored beverage products primarily in North America. The company offers beverages geared to the active and health-conscious consumers, including sparkling waters under the LaCroix, LaCroix Cúrate, LaCroix NiCola, and Shasta brand names; energy drinks and shots under the Rip It brand name; juice and juice-based products under the Everfresh, Everfresh Premier Varietals, and Mr. Pure brand names; and carbonated soft drinks in various flavors comprising regular, sugar-free, and reduced-calorie options under the Shasta and Faygo brands. National Beverage Corp. is a subsidiary of IBS Partners, Ltd.
Latest FIZZ News From Around the Web
Below are the latest news stories about NATIONAL BEVERAGE CORP that investors may wish to consider to help them evaluate FIZZ as an investment opportunity.
Many Would Be Envious Of National Beverage's (NASDAQ:FIZZ) Excellent Returns On CapitalIf you're not sure where to start when looking for the next multi-bagger, there are a few key trends you should keep an... |
National Beverage Commemorates 30 Years of Supporting ‘HOPE’ for the Children of St. JudeFORT LAUDERDALE, Fla., December 15, 2023--Commemorating its 30th year as a continuing partner of St. Jude Children’s Research Hospital®, National Beverage Corp. (NASDAQ: FIZZ) asks all to help St. Jude as it leads the way the world understands, treats and defeats childhood cancer and other life-threatening diseases. St. Jude’s lifesaving mission is clear: Finding Cures. Saving Children.® |
FIZZ Stock Earnings: National Beverage Meets EPS, Misses Revenue for Q2 2024FIZZ stock results show that National Beverage met analyst estimates for earnings per share but missed on revenue for the second quarter of 2024. |
National Beverage Corp. (FIZZ) Announces Record Revenues and Earnings GrowthFinancial Highlights from the Latest Earnings Report |
National Beverage Corp. Reports Record Revenues and Double-Digit Earnings GrowthFORT LAUDERDALE, Fla., December 07, 2023--National Beverage Corp. (NASDAQ: FIZZ) today announced results for its second quarter and six months ended October 28, 2023. Compared to the prior year: |
FIZZ Price Returns
1-mo | -7.93% |
3-mo | -4.75% |
6-mo | 0.72% |
1-year | -10.49% |
3-year | -2.09% |
5-year | 64.07% |
YTD | -4.75% |
2023 | 6.86% |
2022 | 2.65% |
2021 | 6.78% |
2020 | 66.41% |
2019 | -28.91% |
Continue Researching FIZZ
Here are a few links from around the web to help you further your research on National Beverage Corp's stock as an investment opportunity:National Beverage Corp (FIZZ) Stock Price | Nasdaq
National Beverage Corp (FIZZ) Stock Quote, History and News - Yahoo Finance
National Beverage Corp (FIZZ) Stock Price and Basic Information | MarketWatch
Loading social stream, please wait...