Flex Ltd. (FLEX): Price and Financial Metrics
GET POWR RATINGS... FREE!
FLEX Price/Volume Stats
Current price | $25.91 | 52-week high | $26.04 |
Prev. close | $25.47 | 52-week low | $13.63 |
Day low | $25.39 | Volume | 6,373,900 |
Day high | $26.04 | Avg. volume | 4,939,194 |
50-day MA | $21.90 | Dividend yield | N/A |
200-day MA | $20.93 | Market Cap | 11.52B |
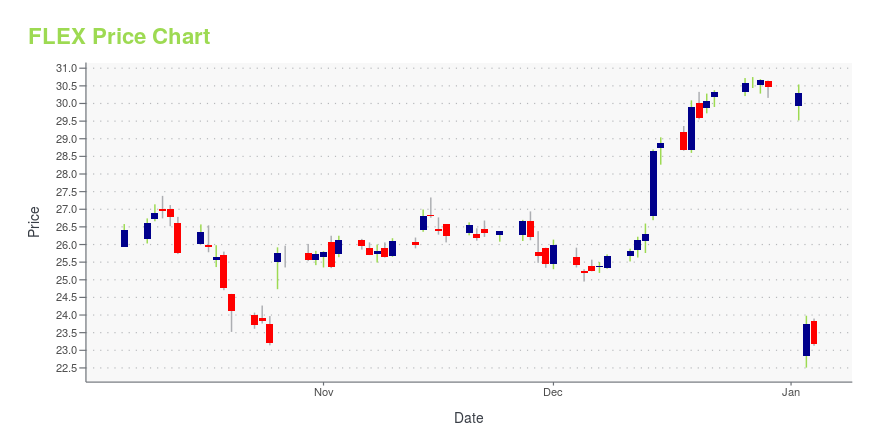
FLEX Stock Price Chart Interactive Chart >
FLEX POWR Grades
- FLEX scores best on the Momentum dimension, with a Momentum rank ahead of 98.45% of US stocks.
- FLEX's strongest trending metric is Momentum; it's been moving up over the last 179 days.
- FLEX's current lowest rank is in the Value metric (where it is better than 30.83% of US stocks).
FLEX Stock Summary
- FLEX has a higher market value than 85.44% of US stocks; more precisely, its current market capitalization is $10,890,091,877.
- The capital turnover (annual revenue relative to shareholder's equity) for FLEX is 5.67 -- better than 92.31% of US stocks.
- With a price/sales ratio of 0.36, FLEX LTD has a higher such ratio than just 12.93% of stocks in our set.
- Stocks with similar financial metrics, market capitalization, and price volatility to FLEX LTD are FDS, MTG, BHE, DCO, and VC.
- FLEX's SEC filings can be seen here. And to visit FLEX LTD's official web site, go to www.flex.com.
FLEX Valuation Summary
- FLEX's price/sales ratio is 0.4; this is 84.62% lower than that of the median Technology stock.
- FLEX's EV/EBIT ratio has moved up 95.4 over the prior 243 months.
Below are key valuation metrics over time for FLEX.
Stock | Date | P/S | P/B | P/E | EV/EBIT |
---|---|---|---|---|---|
FLEX | 2023-05-22 | 0.4 | 2.0 | 13.7 | 12.8 |
FLEX | 2023-05-19 | 0.4 | 2.0 | 13.6 | 12.7 |
FLEX | 2023-05-18 | 0.4 | 2.4 | 13.3 | 9.5 |
FLEX | 2023-05-17 | 0.4 | 2.4 | 13.2 | 9.5 |
FLEX | 2023-05-16 | 0.4 | 2.3 | 12.9 | 9.3 |
FLEX | 2023-05-15 | 0.4 | 2.4 | 13.0 | 9.4 |
FLEX Growth Metrics
- Its 3 year revenue growth rate is now at -0.65%.
- Its year over year revenue growth rate is now at 7.95%.
- The 4 year cash and equivalents growth rate now stands at 5.03%.

The table below shows FLEX's growth in key financial areas (numbers in millions of US dollars).
Date | Revenue | Operating Cash Flow | Net Income to Common Stock |
---|---|---|---|
2022-12-31 | 29,720 | 860 | 818 |
2022-09-30 | 28,583 | 651 | 815 |
2022-06-30 | 27,046 | 728 | 919 |
2022-03-31 | 26,041 | 1,024 | 936 |
2021-12-31 | 25,456 | 825 | 1,009 |
2021-09-30 | 25,557 | 1,023 | 990 |
FLEX's Quality Factors
The “Quality” component of the POWR Ratings focuses on 31 different factors of a companies fundamentals and operational strength. Here are some key insights as we drill into the specifics of these quality attributes.- FLEX has a Quality Grade of C, ranking ahead of 59.7% of graded US stocks.
- FLEX's asset turnover comes in at 1.587 -- ranking 15th of 208 Electronic Equipment stocks.
- VICR, VPG, and IRDM are the stocks whose asset turnover ratios are most correlated with FLEX.
The table below shows FLEX's key quality metrics over time.
Period | Asset Turnover | Gross Margin | ROIC |
---|---|---|---|
2021-10-01 | 1.587 | 0.075 | 0.127 |
2021-07-02 | 1.615 | 0.073 | 0.120 |
2021-03-31 | 1.591 | 0.070 | 0.102 |
2020-12-31 | 1.596 | 0.066 | 0.074 |
2020-09-25 | 1.621 | 0.065 | 0.070 |
2020-06-26 | 1.649 | 0.056 | 0.042 |
FLEX Price Target
For more insight on analysts targets of FLEX, see our FLEX price target page. And for a list of of all stocks sorted by upside potential based on analyst target price, see our Top Price Target page.
Average Price Target | $23.71 | Average Broker Recommendation | 1.4 (Strong Buy) |
Flex Ltd. (FLEX) Company Bio
Flextronics provides design, manufacturing, and supply chain services and solutions to original equipment manufacturers worldwide. The company was founded in 1990 and is based in San Jose, California.
Latest FLEX News From Around the Web
Below are the latest news stories about FLEX LTD that investors may wish to consider to help them evaluate FLEX as an investment opportunity.
Flex Ltd. (NASDAQ:FLEX) Q4 2023 Earnings Call TranscriptFlex Ltd. (NASDAQ:FLEX) Q4 2023 Earnings Call Transcript May 10, 2023 Flex Ltd. beats earnings expectations. Reported EPS is $0.6, expectations were $0.51. Operator: Good afternoon. Thank you for standing by. Welcome to Flex’s Fourth Quarter and Fiscal 2023 Earnings Conference Call. [Operator Instructions]. I will now turn the call over to Mr. David Rubin, […] |
Flex Ltd Stock Scores Relative Strength Rating UpgradeWhen looking for the best stocks to buy and watch, focus on those with rising relative price strength. One stock that fits that bill is Flex Ltd stock, which saw a positive improvement to its Relative Strength (RS) Rating on Friday, with an upgrade from 80 to 90. When you're researching the best stocks to buy and watch, keep a close on eye on relative price strength. |
FLEX Q4 Earnings and Revenues Beat Estimates, Increase Y/YFLEX fourth-quarter fiscal 2023 performance benefits from strong demand across most of the business segments amid macroeconomic disruptions |
Flex to Participate in Upcoming Investor ConferenceFlex (NASDAQ: FLEX) has announced members of its leadership team will participate in the upcoming investor conference: |
FLEX REPORTS FOURTH QUARTER AND FISCAL 2023 RESULTSFlex (NASDAQ: FLEX) today announced results for its fourth quarter and fiscal year ended March 31, 2023. |
FLEX Price Returns
1-mo | 25.96% |
3-mo | 13.84% |
6-mo | 17.88% |
1-year | 51.08% |
3-year | 166.84% |
5-year | 83.63% |
YTD | 20.74% |
2022 | 17.08% |
2021 | 1.95% |
2020 | 42.47% |
2019 | 65.83% |
2018 | -57.70% |
Continue Researching FLEX
Want to do more research on Flex Ltd's stock and its price? Try the links below:Flex Ltd (FLEX) Stock Price | Nasdaq
Flex Ltd (FLEX) Stock Quote, History and News - Yahoo Finance
Flex Ltd (FLEX) Stock Price and Basic Information | MarketWatch
Loading social stream, please wait...