
Fulgent Genetics, Inc. (FLGT): Price and Financial Metrics
FLGT Price/Volume Stats
| Current price | $23.66 | 52-week high | $44.09 |
| Prev. close | $22.99 | 52-week low | $18.91 |
| Day low | $22.98 | Volume | 144,961 |
| Day high | $23.66 | Avg. volume | 190,320 |
| 50-day MA | $20.94 | Dividend yield | N/A |
| 200-day MA | $23.80 | Market Cap | 708.00M |
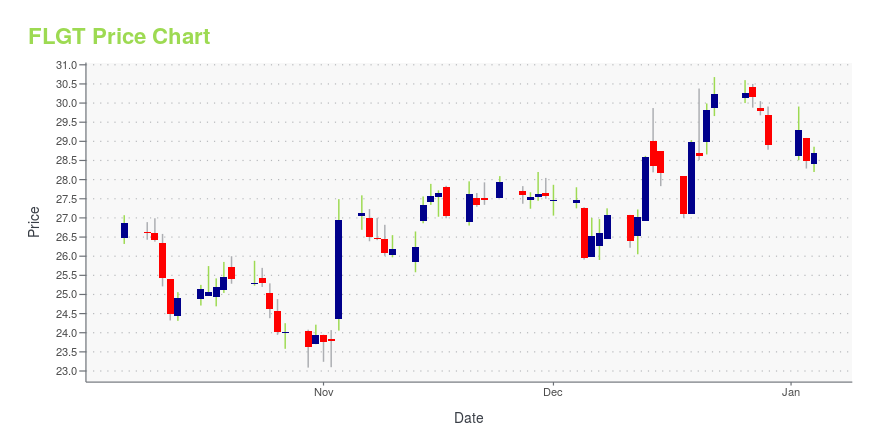
FLGT Stock Price Chart Interactive Chart >
Fulgent Genetics, Inc. (FLGT) Company Bio
Fulgent Genetics, Inc., a technology company, focuses on providing genetic testing services to physicians with clinically actionable diagnostic information. It intends to provide tests to hospitals and medical institutions. The company was formerly known as Fulgent Diagnostics, Inc. and changed its name to Fulgent Genetics, Inc. in August 2016. The company was founded in 2011 and is based in Temple City, California.
Latest FLGT News From Around the Web
Below are the latest news stories about FULGENT GENETICS INC that investors may wish to consider to help them evaluate FLGT as an investment opportunity.
The 3 Best Digital Health Stocks for Personalized MedicineDigital health stocks are becoming increasingly relelvant as more and more people seek greater control over their health. |
Fulgent to Participate in the Piper Sandler 35th Annual Healthcare ConferenceEL MONTE, Calif., November 14, 2023--Fulgent Genetics, Inc. (NASDAQ: FLGT) ("Fulgent" or the "Company"), a technology-based company with a well-established clinical diagnostic business and a therapeutic development business, today announced that members of its management team are scheduled to participate in the Piper Sandler 35th Annual Healthcare Conference on Tuesday, November 28, 2023. |
Fulgent Genetics, Inc. (NASDAQ:FLGT) Q3 2023 Earnings Call TranscriptFulgent Genetics, Inc. (NASDAQ:FLGT) Q3 2023 Earnings Call Transcript November 3, 2023 Operator: Hello, and welcome to the Fulgent Genetics Q3 2023 Earnings Conference Call and Webcast. [Operator Instructions] A question-and-answer session will follow the formal presentation. [Operator Instructions] As a reminder, this conference is being recorded. It’s now my pleasure to turn the call […] |
Q3 2023 Fulgent Genetics Inc Earnings CallQ3 2023 Fulgent Genetics Inc Earnings Call |
Fulgent Shares Data from Two Poster Presentations at SITC 2023 Annual MeetingEL MONTE, Calif., November 03, 2023--Fulgent Genetics, Inc. (NASDAQ: FLGT) ("Fulgent" or the "Company"), a technology-based company with a well-established clinical diagnostic business and a therapeutic development business, today announced data from two poster presentations being presented tomorrow, November 4, 2023, at the Society for Immunotherapy of Cancer (SITC) 38th Annual Meeting in San Diego, CA. |
FLGT Price Returns
| 1-mo | 16.21% |
| 3-mo | 17.71% |
| 6-mo | -7.58% |
| 1-year | -37.57% |
| 3-year | -74.47% |
| 5-year | 278.56% |
| YTD | -18.16% |
| 2023 | -2.92% |
| 2022 | -70.39% |
| 2021 | 93.07% |
| 2020 | 303.88% |
| 2019 | 306.94% |
Continue Researching FLGT
Want to do more research on Fulgent Genetics Inc's stock and its price? Try the links below:Fulgent Genetics Inc (FLGT) Stock Price | Nasdaq
Fulgent Genetics Inc (FLGT) Stock Quote, History and News - Yahoo Finance
Fulgent Genetics Inc (FLGT) Stock Price and Basic Information | MarketWatch
Loading social stream, please wait...