Fluent, Inc. (FLNT): Price and Financial Metrics

Fluent, Inc. (FLNT): $0.45

0.01 (-1.30%)

POWR Rating

Component Grades

Momentum

C

Stability

C

Sentiment

Quality

C

Add FLNT to Watchlist
Sign Up

Industry: Software - Business

Industry

C

Ranked

#16 of 52

in industry

FLNT Price/Volume Stats

Current price $0.45 52-week high $1.81
Prev. close $0.46 52-week low $0.41
Day low $0.45 Volume 46,400
Day high $0.47 Avg. volume 164,244
50-day MA $0.63 Dividend yield N/A
200-day MA $0.89 Market Cap 36.84M

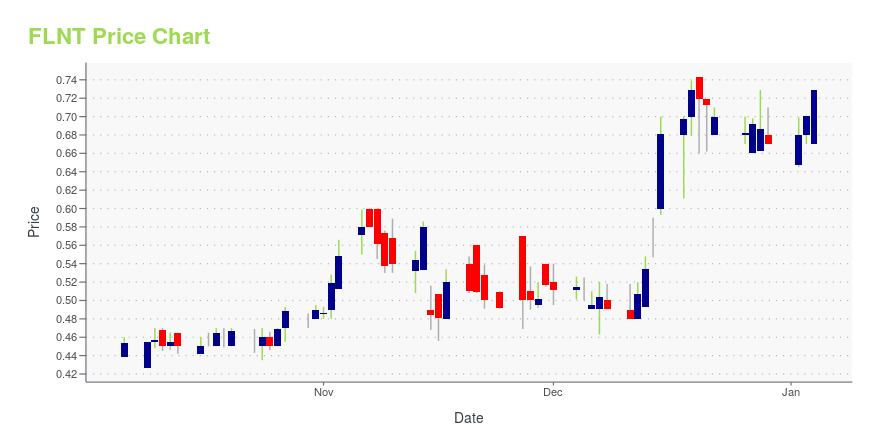
FLNT Stock Price Chart Interactive Chart >

FLNT POWR Grades

  • Value is the dimension where FLNT ranks best; there it ranks ahead of 97.54% of US stocks.
  • FLNT's strongest trending metric is Value; it's been moving up over the last 86 days.
  • FLNT's current lowest rank is in the Momentum metric (where it is better than 25.17% of US stocks).

FLNT Stock Summary

  • FLUENT INC's capital turnover -- a measure of revenue relative to shareholder's equity -- is better than 90.6% of US listed stocks.
  • With a price/sales ratio of 0.11, FLUENT INC has a higher such ratio than merely 2.98% of stocks in our set.
  • In terms of volatility of its share price, FLNT is more volatile than 90.17% of stocks we're observing.
  • Stocks with similar financial metrics, market capitalization, and price volatility to FLUENT INC are PTPI, VCSA, UAVS, GAN, and TEVA.
  • FLNT's SEC filings can be seen here. And to visit FLUENT INC's official web site, go to www.fluentco.com.

FLNT Valuation Summary

  • In comparison to the median Communication Services stock, FLNT's price/sales ratio is 92.86% lower, now standing at 0.1.
  • Over the past 100 months, FLNT's EV/EBIT ratio has gone up 3.2.

Below are key valuation metrics over time for FLNT.

Stock Date P/S P/B P/E EV/EBIT
FLNT 2023-09-21 0.1 0.6 -0.4 -0.7
FLNT 2023-09-20 0.1 0.5 -0.4 -0.6
FLNT 2023-09-19 0.1 0.6 -0.4 -0.7
FLNT 2023-09-18 0.1 0.6 -0.4 -0.7
FLNT 2023-09-15 0.1 0.6 -0.4 -0.7
FLNT 2023-09-14 0.1 0.7 -0.5 -0.8

FLNT Growth Metrics

    Its 2 year cash and equivalents growth rate is now at 98.71%.
  • Its 4 year net income to common stockholders growth rate is now at 91.44%.
  • The 3 year price growth rate now stands at -79.34%.
FLNT's revenue has moved up $137,625,000 over the prior 49 months.

The table below shows FLNT's growth in key financial areas (numbers in millions of US dollars).

Date Revenue Operating Cash Flow Net Income to Common Stock
2022-09-30 376.314 26.49 -52.014
2022-06-30 373.126 11.142 -57.579
2022-03-31 348.143 5.671 -5.814
2021-12-31 329.25 12.424 -10.059
2021-09-30 311.402 0.505 -13.711
2021-06-30 303.824 9.801 -10.09

FLNT's Quality Factors

The “Quality” component of the POWR Ratings focuses on 31 different factors of a companies fundamentals and operational strength. Here are some key insights as we drill into the specifics of these quality attributes.
  • FLNT has a Quality Grade of D, ranking ahead of 19.99% of graded US stocks.
  • FLNT's asset turnover comes in at 0.979 -- ranking 134th of 561 Business Services stocks.
  • MGI, SPLK, and VRSN are the stocks whose asset turnover ratios are most correlated with FLNT.

The table below shows FLNT's key quality metrics over time.

Period Asset Turnover Gross Margin ROIC
2021-06-30 0.979 0.285 -0.064
2021-03-31 0.975 0.306 0.015
2020-12-31 1.009 0.308 0.100
2020-09-30 0.997 0.306 0.104
2020-06-30 0.948 0.301 0.043
2020-03-31 0.950 0.299 0.049

FLNT Price Target

For more insight on analysts targets of FLNT, see our FLNT price target page. And for a list of of all stocks sorted by upside potential based on analyst target price, see our Top Price Target page.

Average Price Target $5.00 Average Broker Recommendation 1.5 (Moderate Buy)

Fluent, Inc. (FLNT) Company Bio


Fluent Inc. (formerly Cogint, Inc.) provides data and analytical solutions in the United States. It empowers clients across markets and industries to execute various aspects of their business, including managing risk, conducting investigations, identifying fraud and abuse, collecting debts, and identifying and acquiring new customers. he company was formerly known as IDI, Inc. and changed its name to Cogint, Inc. in September 2016. The company is based in Boca Raton, Florida.


FLNT Latest News Stream


Event/Time News Detail
Loading, please wait...

FLNT Latest Social Stream


Loading social stream, please wait...

View Full FLNT Social Stream

Latest FLNT News From Around the Web

Below are the latest news stories about FLUENT INC that investors may wish to consider to help them evaluate FLNT as an investment opportunity.

Fluent, Inc. Launches Infuse Influencer Platform to Unlock New Customer Acquisition Opportunities for Advertisers

Leading brands leverage the trusted voices of nano- and micro-influencers to reach untapped audiences with InfuseNEW YORK, Aug. 22, 2023 (GLOBE NEWSWIRE) -- Fluent, Inc. (NASDAQ: FLNT), a leading performance marketing company, today announced the launch of Infuse, a proprietary influencer platform designed to help brands reach incremental audiences through the trusted voices of creators. Led by a team of influencer marketing veterans, Infuse connects brands with a growing community of creators,

Yahoo | August 22, 2023

Fluent, Inc. (NASDAQ:FLNT) Q2 2023 Earnings Call Transcript

Fluent, Inc. (NASDAQ:FLNT) Q2 2023 Earnings Call Transcript August 14, 2023 Fluent, Inc. beats earnings expectations. Reported EPS is $0.0323, expectations were $0.01. Operator: Good afternoon, and welcome. Thank you for joining us to discuss our Second Quarter 2023 Earnings Results. With me today are Fluent’s CEO, Don Patrick; Interim CFO, Ryan Perfit and Chief […]

Yahoo | August 15, 2023

Q2 2023 Fluent Inc Earnings Call

Q2 2023 Fluent Inc Earnings Call

Yahoo | August 15, 2023

Fluent Announces Second Quarter 2023 Financial Results

•Revenue of $82.1 million for Q2 2023 and $159.4 million for FY 2023 •Gross profit (exclusive of depreciation and amortization) of $22.6 million for Q2 2023 and $41.6 million for FY 2023 •Net income of $1.2 million for Q2 2023 and net loss of $30.8 million for FY 2023 •Media margin of $25.9 million for Q2 2023 and $47.9 million for FY 2023 •Adjusted EBITDA of $5.6 million for Q2 2023 and $6.0 million for FY 2023 •Adjusted net income of $1.0 million for Q2 2023 and adjusted net loss of $1.7 milli

Yahoo | August 14, 2023

7 Stocks That Could Triple Your Money by 2024

If you want to get well ahead of the market and don’t mind the risk factor, check out these stocks to triple your money.

Josh Enomoto on InvestorPlace | August 10, 2023

Read More 'FLNT' Stories Here

FLNT Price Returns

1-mo -34.40%
3-mo -27.36%
6-mo -43.75%
1-year -64.84%
3-year -82.63%
5-year -78.57%
YTD -58.72%
2022 -45.23%
2021 -62.52%
2020 112.40%
2019 -30.56%
2018 8.00%

Get Free Updates

Join thousands of investors who get the latest news, insights and top rated picks from StockNews.com!