
FleetCor Technologies Inc. (FLT): Price and Financial Metrics
FLT Price/Volume Stats
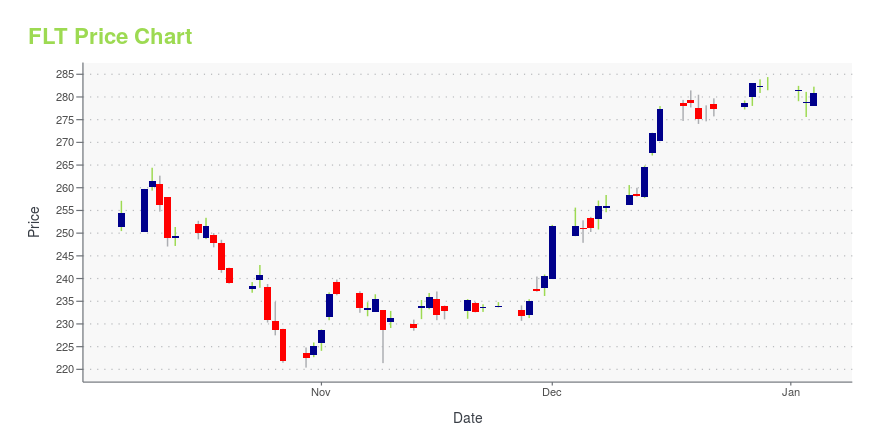
| Current price | $303.26 | 52-week high | $309.39 |
| Prev. close | $305.80 | 52-week low | $194.60 |
| Day low | $303.20 | Volume | 334,900 |
| Day high | $306.52 | Avg. volume | 457,405 |
| 50-day MA | $286.14 | Dividend yield | N/A |
| 200-day MA | $262.55 | Market Cap | 21.90B |
FLT Stock Price Chart Interactive Chart >
FleetCor Technologies Inc. (FLT) Company Bio
FleetCor Technologies, Inc. or FLEETCOR provides fuel cards and workforce payment products and services. Their customers include businesses, commercial fleets, oil companies, petroleum marketers and government in America, Netherlands, Belgium, Germany, Slovakia and various countries. The company provides services through two segments: North American and International segments. FLEETCOR's predecessor company was founded in the United States in 1986. (Source:Wikipedia)
Latest FLT News From Around the Web
Below are the latest news stories about FLEETCOR TECHNOLOGIES INC that investors may wish to consider to help them evaluate FLT as an investment opportunity.
CLC Lodging Launches Updated Portal for Hotel PartnersWICHITA, Kan., December 20, 2023--CLC Lodging, America’s workforce lodging leader and a FLEETCOR company, announced the launch of its updated online hotel portal with new features that empower its hotel partners to deliver an exceptional guest experience. |
Corpay Cross-Border Expands Global Presence with a New Office in Chennai, IndiaTORONTO, December 19, 2023--Corpay1, a FLEETCOR® (NYSE: FLT) brand and global leader in business payments, is thrilled to announce the latest expansion of Corpay’s Cross-Border business with the opening of a new back-office support centre in Chennai, India. This move marks a significant milestone in the company’s ongoing global growth and strengthens its commitment to serving internal stakeholders. |
Corpay Cross-Border Appoints Andrew Shortreid as new SVP Global Institutional SalesTORONTO, December 12, 2023--Corpay1, a FLEETCOR® (NYSE: FLT) brand and global leader in business payments, is pleased to announce that Corpay’s Cross-Border business has appointed investment management industry veteran Andrew Shortreid, CFA as their new SVP Global Institutional Sales. In this newly created role, Andrew will be responsible for leading a team of highly skilled Sales professionals focused on advancing the company’s Cross-Border solutions sales efforts to institutional customers in |
Here's How FLEETCOR's (FLT) Shares Rose 39.4% Year to DateFLEETCOR (FLT) is gaining from its strategic acquisitions and collaborations. Improving liquidity bodes well for the company. |
Why Is FleetCor Technologies (FLT) Up 11.9% Since Last Earnings Report?FleetCor Technologies (FLT) reported earnings 30 days ago. What's next for the stock? We take a look at earnings estimates for some clues. |
FLT Price Returns
| 1-mo | N/A |
| 3-mo | N/A |
| 6-mo | 3.15% |
| 1-year | 23.68% |
| 3-year | 18.03% |
| 5-year | 5.58% |
| YTD | 7.31% |
| 2023 | 53.86% |
| 2022 | -17.94% |
| 2021 | -17.96% |
| 2020 | -5.18% |
| 2019 | 54.92% |
Continue Researching FLT
Here are a few links from around the web to help you further your research on Fleetcor Technologies Inc's stock as an investment opportunity:Fleetcor Technologies Inc (FLT) Stock Price | Nasdaq
Fleetcor Technologies Inc (FLT) Stock Quote, History and News - Yahoo Finance
Fleetcor Technologies Inc (FLT) Stock Price and Basic Information | MarketWatch
Loading social stream, please wait...