
Fresenius Medical Care AG & Co. KGaA ADR (FMS): Price and Financial Metrics
FMS Price/Volume Stats
| Current price | $20.29 | 52-week high | $26.71 |
| Prev. close | $20.39 | 52-week low | $16.37 |
| Day low | $20.13 | Volume | 349,824 |
| Day high | $20.43 | Avg. volume | 400,918 |
| 50-day MA | $20.35 | Dividend yield | 2.23% |
| 200-day MA | $19.76 | Market Cap | 11.91B |
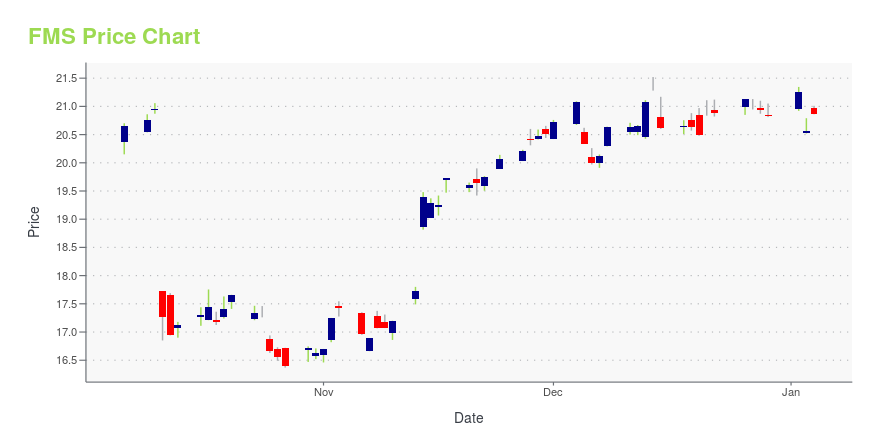
FMS Stock Price Chart Interactive Chart >
Fresenius Medical Care AG & Co. KGaA ADR (FMS) Company Bio
Fresenius Medical Care AG & Co. KGaA is an American German healthcare company which provides kidney dialysis services through a network of 4,171 outpatient dialysis centers, serving 345,425 patients. The company primarily treats end-stage renal disease (ESRD), which requires patients to undergo dialysis 3 times per week for the rest of their lives. (Source:Wikipedia)
Latest FMS News From Around the Web
Below are the latest news stories about FRESENIUS MEDICAL CARE AG that investors may wish to consider to help them evaluate FMS as an investment opportunity.
Reasons to Retain Fresenius Medical (FMS) in Your Portfolio NowFresenius Medical (FMS) continues to gain traction through its broad dialysis product and service portfolio. Intense competition is a woe. |
Fresenius Medical Care says data on 500,000 people stolen in U.SFRANKFURT (Reuters) -Dialysis group Fresenius Medical Care said on Wednesday that data including medical records on 500,000 patients and former patients were stolen from a U.S. subsidiary's data warehouse. "The incident may have affected approximately 500,000 patients, former patients, guarantors and 200 staff located across several states, U.S. territories and four countries," the German company said in a statement. It said it launched an investigation with the help of a forensic firm after subsidiary Cardiovascular Consultants Ltd on Sept. 29 became aware of a security incident affecting some of its U.S. computer systems and an intruder claimed to have stolen data. |
Fresenius Medical Care completes change of legal form into a German stock corporationFresenius Medical Care, the world's leading provider of products and services for individuals with renal diseases, announces the successful completion of its change of legal form from a partnership limited by shares (Kommanditgesellschaft auf Aktien, KGaA) into a German stock corporation (Aktiengesellschaft, AG) as of November 30, 2023. With this important milestone, Fresenius Medical Care is opening a new chapter in the history of the Company with a simplified corporate governance structure tha |
Only Have $100? 3 No-Brainer Stocks to Buy Right NowThe stock market is such a well-oiled, wealth-generating machine that investors can start with just $100 to buy these no-brainer stocks. |
Be Wary Of Fresenius Medical Care KGaA (ETR:FME) And Its Returns On CapitalWhat trends should we look for it we want to identify stocks that can multiply in value over the long term? One common... |
FMS Price Returns
| 1-mo | 6.23% |
| 3-mo | 2.98% |
| 6-mo | 3.14% |
| 1-year | -21.38% |
| 3-year | -46.96% |
| 5-year | -41.52% |
| YTD | -0.63% |
| 2023 | 29.74% |
| 2022 | -48.81% |
| 2021 | -20.79% |
| 2020 | 14.17% |
| 2019 | 15.01% |
FMS Dividends
| Ex-Dividend Date | Type | Payout Amount | Change | ||||||
|---|---|---|---|---|---|---|---|---|---|
| Loading, please wait... | |||||||||
Continue Researching FMS
Want to see what other sources are saying about Fresenius Medical Care AG & Co KGaA's financials and stock price? Try the links below:Fresenius Medical Care AG & Co KGaA (FMS) Stock Price | Nasdaq
Fresenius Medical Care AG & Co KGaA (FMS) Stock Quote, History and News - Yahoo Finance
Fresenius Medical Care AG & Co KGaA (FMS) Stock Price and Basic Information | MarketWatch
Loading social stream, please wait...