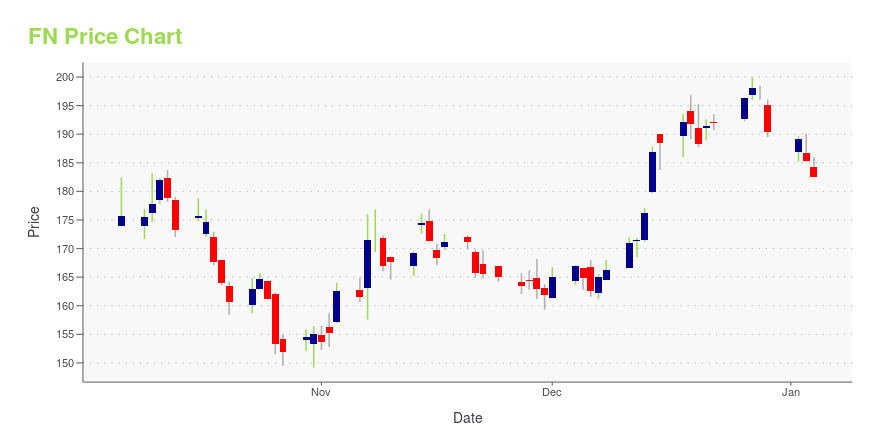
Fabrinet Ordinary Shares (FN): Price and Financial Metrics
FN Price/Volume Stats
Current price | $156.08 | 52-week high | $163.88 |
Prev. close | $151.27 | 52-week low | $90.19 |
Day low | $151.78 | Volume | 431,700 |
Day high | $157.53 | Avg. volume | 316,852 |
50-day MA | $137.88 | Dividend yield | N/A |
200-day MA | $122.90 | Market Cap | 5.65B |
FN Stock Price Chart Interactive Chart >
FN POWR Grades
- FN scores best on the Momentum dimension, with a Momentum rank ahead of 94.83% of US stocks.
- FN's strongest trending metric is Stability; it's been moving down over the last 179 days.
- FN ranks lowest in Value; there it ranks in the 2nd percentile.
FN Stock Summary
- The price/operating cash flow metric for FABRINET is higher than 83.33% of stocks in our set with a positive cash flow.
- FN's equity multiplier -- a measure of assets relative to shareholders'equity -- is greater than that of just 21.44% of US stocks.
- With a year-over-year growth in debt of -33.17%, FABRINET's debt growth rate surpasses merely 9.61% of about US stocks.
- Stocks that are quantitatively similar to FN, based on their financial statements, market capitalization, and price volatility, are CLOV, TWKS, FRGE, SGBX, and OPRX.
- FN's SEC filings can be seen here. And to visit FABRINET's official web site, go to www.fabrinet.com.
FN Valuation Summary
- FN's price/earnings ratio is 22.1; this is 15.49% lower than that of the median Technology stock.
- FN's price/earnings ratio has moved up 10.5 over the prior 161 months.
Below are key valuation metrics over time for FN.
Stock | Date | P/S | P/B | P/E | EV/EBIT |
---|---|---|---|---|---|
FN | 2023-09-15 | 2.1 | 3.7 | 22.1 | 20.1 |
FN | 2023-09-14 | 2.1 | 3.7 | 21.9 | 20.0 |
FN | 2023-09-13 | 2.0 | 3.7 | 21.6 | 19.7 |
FN | 2023-09-12 | 2.0 | 3.7 | 21.7 | 19.8 |
FN | 2023-09-11 | 2.1 | 3.7 | 22.2 | 20.3 |
FN | 2023-09-08 | 2.1 | 3.7 | 22.1 | 20.2 |
FN Growth Metrics
- Its 5 year net income to common stockholders growth rate is now at 32.48%.
- The year over year price growth rate now stands at 10.23%.
- The 4 year price growth rate now stands at 57.49%.

The table below shows FN's growth in key financial areas (numbers in millions of US dollars).
Date | Revenue | Operating Cash Flow | Net Income to Common Stock |
---|---|---|---|
2022-12-31 | 2,476.354 | 171.778 | 234.622 |
2022-09-30 | 2,374.331 | 145.865 | 220.344 |
2022-06-30 | 2,262.224 | 124.246 | 200.38 |
2022-03-31 | 2,183.917 | 151.405 | 186.604 |
2021-12-31 | 2,098.839 | 134.919 | 173.436 |
2021-09-30 | 1,986.033 | 123.174 | 159.941 |
FN's Quality Factors
The “Quality” component of the POWR Ratings focuses on 31 different factors of a companies fundamentals and operational strength. Here are some key insights as we drill into the specifics of these quality attributes.- FN has a Quality Grade of B, ranking ahead of 87.16% of graded US stocks.
- FN's asset turnover comes in at 1.262 -- ranking 26th of 208 Electronic Equipment stocks.
- BELFA, MICT, and JCS are the stocks whose asset turnover ratios are most correlated with FN.
The table below shows FN's key quality metrics over time.
Period | Asset Turnover | Gross Margin | ROIC |
---|---|---|---|
2021-09-24 | 1.262 | 0.118 | 0.170 |
2021-06-25 | 1.244 | 0.118 | 0.162 |
2021-03-26 | 1.223 | 0.117 | 0.152 |
2020-12-25 | 1.212 | 0.114 | 0.145 |
2020-09-25 | 1.232 | 0.114 | 0.146 |
2020-06-26 | 1.235 | 0.113 | 0.145 |
FN Price Target
For more insight on analysts targets of FN, see our FN price target page. And for a list of of all stocks sorted by upside potential based on analyst target price, see our Top Price Target page.
Average Price Target | $105.25 | Average Broker Recommendation | 1.8 (Moderate Buy) |
Fabrinet Ordinary Shares (FN) Company Bio
Fabrinet is a provider of advanced optical packaging and precision optical, electro-mechanical, and electronic manufacturing services to original equipment manufacturers of complex products, such as optical communication components, modules and subsystems, industrial lasers and sensors. The company was founded in 1999 and is based in George Town, the Cayman Islands.
Latest FN News From Around the Web
Below are the latest news stories about FABRINET that investors may wish to consider to help them evaluate FN as an investment opportunity.
Should You Think About Buying Fabrinet (NYSE:FN) Now?Fabrinet ( NYSE:FN ), is not the largest company out there, but it led the NYSE gainers with a relatively large price... |
What Made Fabrinet (FN) Outperform in Q2?Investment management company First Pacific Advisors recently released its “FPA Queens Road Small Cap Value Fund” second quarter 2023 investor letter. A copy of the same can be downloaded here. In the second quarter, the fund returned 4.20% compared to a 3.18% return for the Russell 2000 Value Index. The Fund returned 4.93% in the first half compared […] |
Stocks to Watch: 3 Smaller Tech Players Ready for a BreakoutDue diligence for tech stocks is critical in today's constrained market, but these companies have strong underlying prospects. |
Top 5 High-Flying Mid-Cap Stocks Despite a Volatile AugustWe have narrowed our search to five mid-cap stocks that have provided double-digit returns in the past month. These are: FN, FRSH, HRB, EXEL, PSN. |
Calculating The Intrinsic Value Of Fabrinet (NYSE:FN)Key Insights The projected fair value for Fabrinet is US$133 based on 2 Stage Free Cash Flow to Equity Fabrinet's... |
FN Price Returns
1-mo | -0.45% |
3-mo | 25.60% |
6-mo | 38.94% |
1-year | 69.27% |
3-year | 150.65% |
5-year | 240.56% |
YTD | 21.73% |
2022 | 8.23% |
2021 | 52.69% |
2020 | 19.66% |
2019 | 26.37% |
2018 | 78.78% |
Continue Researching FN
Here are a few links from around the web to help you further your research on Fabrinet's stock as an investment opportunity:Fabrinet (FN) Stock Price | Nasdaq
Fabrinet (FN) Stock Quote, History and News - Yahoo Finance
Fabrinet (FN) Stock Price and Basic Information | MarketWatch
Loading social stream, please wait...