
FNCB Bancorp Inc. (FNCB): Price and Financial Metrics
FNCB Price/Volume Stats
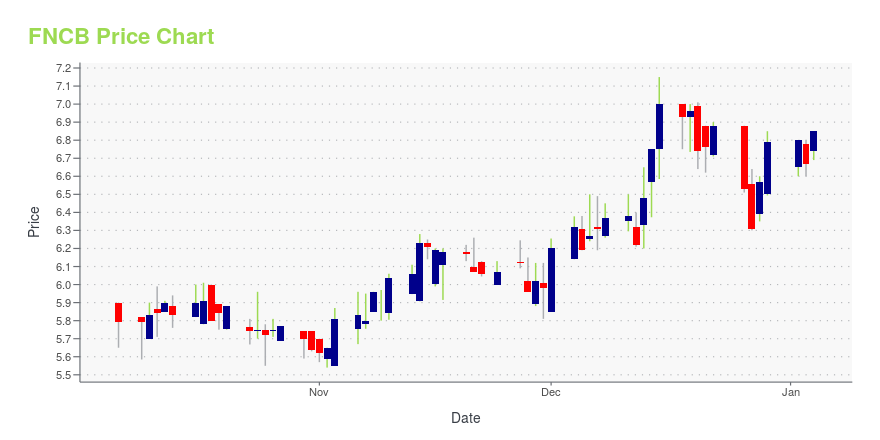
| Current price | $6.75 | 52-week high | $7.15 |
| Prev. close | $6.41 | 52-week low | $5.17 |
| Day low | $6.35 | Volume | 82,500 |
| Day high | $6.82 | Avg. volume | 24,851 |
| 50-day MA | $5.74 | Dividend yield | 5.33% |
| 200-day MA | $6.01 | Market Cap | 133.62M |
FNCB Stock Price Chart Interactive Chart >
FNCB Bancorp Inc. (FNCB) Company Bio
FNCB Bancorp, Inc. operates as the holding company for FNCB Bank that provides retail and commercial banking services to individuals and businesses in Northeastern Pennsylvania. The company was founded in 1910 and is based in Dunmore, Pennsylvania.
Latest FNCB News From Around the Web
Below are the latest news stories about FNCB BANCORP INC that investors may wish to consider to help them evaluate FNCB as an investment opportunity.
FNCB Bancorp (NASDAQ:FNCB) Is Due To Pay A Dividend Of $0.09FNCB Bancorp, Inc. ( NASDAQ:FNCB ) will pay a dividend of $0.09 on the 15th of December. This means the annual payment... |
FNCB Bancorp, Inc. Announces Third Quarter 2023 ResultsDUNMORE, Pa., Oct. 30, 2023 (GLOBE NEWSWIRE) -- FNCB Bancorp, Inc. (NASDAQ: FNCB; www.fncb.com), the parent company of Dunmore-based FNCB Bank (the “Bank”), (collectively, "FNCB") today reported net income of $4.2 million, or $0.21 per basic and diluted share, for the three months ended September 30, 2023, a decrease of $1.2 million, or 23.4%, compared to $5.4 million, or $0.28 per share for the same period of 2022. Reductions in net interest income and non-interest income, coupled with an incre |
FNCB Bancorp, Inc. Declares Fourth Quarter 2023 DividendDUNMORE, Pa., Oct. 25, 2023 (GLOBE NEWSWIRE) -- On October 25, 2023, the Board of Directors of FNCB Bancorp, Inc. (NASDAQ:FNCB) declared a dividend of $0.090 per share for the fourth quarter of 2023. The fourth quarter 2023 dividend is payable on December 15, 2023 to shareholders of record as of December 1, 2023. Year-to-date dividends declared in 2023 total $0.36 per share, an increase of $0.03 per share, or 9.1%, compared to $0.33 per share in 2022. About FNCB Bancorp, Inc.: FNCB Bancorp, Inc. |
Two northeastern Pennsylvania banks to mergePeoples Financial Services has agreed to pay $129 million of stock for FNCB Bancorp. Peoples' CEO Craig Best would lead the combined company for a year after the merger closes, and then Gerard Champi, FNCB's current chief, would take over. |
Peoples Financial (PFIS) & FNCB Bancorp Sign Merger DealPeoples Financial (PFIS) signs a merger agreement with FNCB Bancorp. The EPS accretion in 2025 for PFIS and FNCB is expected to be 59% and more than 40%, respectively. |
FNCB Price Returns
| 1-mo | 9.93% |
| 3-mo | 24.88% |
| 6-mo | 2.32% |
| 1-year | 13.20% |
| 3-year | 9.38% |
| 5-year | 8.04% |
| YTD | 4.28% |
| 2023 | -12.33% |
| 2022 | -7.53% |
| 2021 | 49.36% |
| 2020 | -21.61% |
| 2019 | 2.75% |
FNCB Dividends
| Ex-Dividend Date | Type | Payout Amount | Change | ||||||
|---|---|---|---|---|---|---|---|---|---|
| Loading, please wait... | |||||||||
Continue Researching FNCB
Want to do more research on FNCB Bancorp Inc's stock and its price? Try the links below:FNCB Bancorp Inc (FNCB) Stock Price | Nasdaq
FNCB Bancorp Inc (FNCB) Stock Quote, History and News - Yahoo Finance
FNCB Bancorp Inc (FNCB) Stock Price and Basic Information | MarketWatch
Loading social stream, please wait...