Funko, Inc. - (FNKO): Price and Financial Metrics
FNKO Price/Volume Stats
Current price | $6.24 | 52-week high | $13.42 |
Prev. close | $6.27 | 52-week low | $5.27 |
Day low | $6.18 | Volume | 568,674 |
Day high | $6.47 | Avg. volume | 455,297 |
50-day MA | $6.97 | Dividend yield | N/A |
200-day MA | $7.52 | Market Cap | 331.15M |
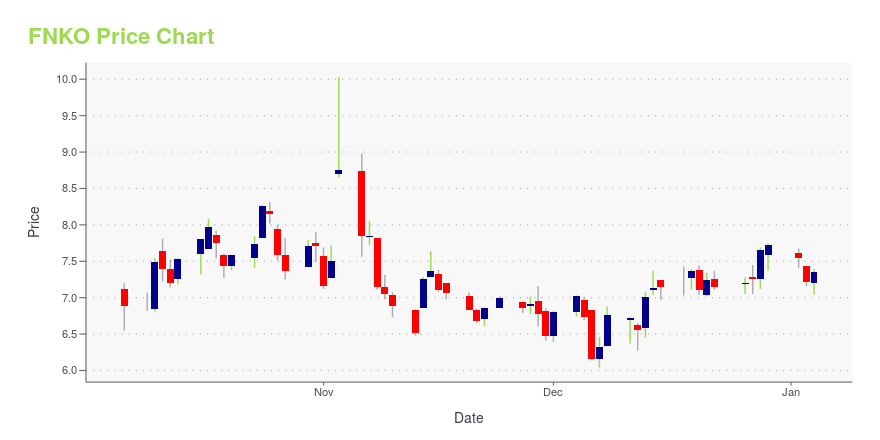
FNKO Stock Price Chart Interactive Chart >
FNKO POWR Grades
- Growth is the dimension where FNKO ranks best; there it ranks ahead of 58.51% of US stocks.
- The strongest trend for FNKO is in Growth, which has been heading up over the past 26 weeks.
- FNKO's current lowest rank is in the Stability metric (where it is better than 12.26% of US stocks).
FNKO Stock Summary
- The capital turnover (annual revenue relative to shareholder's equity) for FNKO is 4.9 -- better than 90.49% of US stocks.
- With a price/sales ratio of 0.33, FUNKO INC has a higher such ratio than merely 10.79% of stocks in our set.
- Over the past twelve months, FNKO has reported earnings growth of -182.02%, putting it ahead of merely 7.35% of US stocks in our set.
- Stocks with similar financial metrics, market capitalization, and price volatility to FUNKO INC are VRM, GTIM, HIBB, DLA, and BXC.
- Visit FNKO's SEC page to see the company's official filings. To visit the company's web site, go to www.funko.com.
FNKO Valuation Summary
- FNKO's price/earnings ratio is -2.2; this is 112.57% lower than that of the median Consumer Cyclical stock.
- FNKO's price/earnings ratio has moved down 14.1 over the prior 75 months.
Below are key valuation metrics over time for FNKO.
Stock | Date | P/S | P/B | P/E | EV/EBIT |
---|---|---|---|---|---|
FNKO | 2023-12-29 | 0.4 | 1.8 | -2.2 | -17.2 |
FNKO | 2023-12-28 | 0.4 | 1.7 | -2.2 | -17.1 |
FNKO | 2023-12-27 | 0.3 | 1.6 | -2.1 | -16.7 |
FNKO | 2023-12-26 | 0.3 | 1.6 | -2.0 | -16.6 |
FNKO | 2023-12-22 | 0.3 | 1.6 | -2.0 | -16.5 |
FNKO | 2023-12-21 | 0.3 | 1.6 | -2.1 | -16.6 |
FNKO's Quality Factors
The “Quality” component of the POWR Ratings focuses on 31 different factors of a companies fundamentals and operational strength. Here are some key insights as we drill into the specifics of these quality attributes.- FNKO has a Quality Grade of B, ranking ahead of 82.59% of graded US stocks.
- FNKO's asset turnover comes in at 1.073 -- ranking 11th of 21 Recreation stocks.
- CLAR, KN, and ESCA are the stocks whose asset turnover ratios are most correlated with FNKO.
The table below shows FNKO's key quality metrics over time.
Period | Asset Turnover | Gross Margin | ROIC |
---|---|---|---|
2021-06-30 | 1.073 | 0.390 | 0.121 |
2021-03-31 | 0.932 | 0.386 | 0.059 |
2020-12-31 | 0.866 | 0.382 | 0.032 |
2020-09-30 | 0.840 | 0.355 | -0.002 |
2020-06-30 | 0.869 | 0.356 | 0.000 |
2020-03-31 | 0.993 | 0.359 | 0.037 |
FNKO Price Target
For more insight on analysts targets of FNKO, see our FNKO price target page. And for a list of of all stocks sorted by upside potential based on analyst target price, see our Top Price Target page.
Average Price Target | $24.65 | Average Broker Recommendation | 1.61 (Moderate Buy) |
Funko, Inc. - (FNKO) Company Bio
Funko, LLC offers consumer products, toys, and collectibles. The company provides keychains, pens, pins, ride toys, and other toys; vinyl products; apparel, accessories, and T-shirts and hats; action figures; plush products; and housewares, home products, and accessories. It offers products online, as well as through stores worldwide. Funko, LLC was founded in 1998 and is based in Lynnwood, Washington with a retail store in Everett, Washington.
Latest FNKO News From Around the Web
Below are the latest news stories about FUNKO INC that investors may wish to consider to help them evaluate FNKO as an investment opportunity.
Shareholders in Funko (NASDAQ:FNKO) are in the red if they invested five years agoIn order to justify the effort of selecting individual stocks, it's worth striving to beat the returns from a market... |
7 Stocks with Strong Insider Buying: December 2023Stocks with strong insider buying should make you curious, and finding them can be a useful shortcut for your research |
Why Funko Stock Is Soaring TodayFunko (NASDAQ: FNKO) stock is seeing big gains in Friday's trading. Funko published third-quarter earnings results after the market closed yesterday, and its sales and earnings performance topped Wall Street's expectations. The company reported a non-GAAP (adjusted) profit of $0.03 per share on sales of $312.9 million, beating the average analyst earnings target by $0.08 per share and the average sales target by roughly $23.3 million. |
Funko, Inc. (NASDAQ:FNKO) Q3 2023 Earnings Call TranscriptFunko, Inc. (NASDAQ:FNKO) Q3 2023 Earnings Call Transcript November 2, 2023 Funko, Inc. beats earnings expectations. Reported EPS is $0.03, expectations were $-0.08. Operator: Good afternoon and welcome to Funko’s 2023 Third Quarter Financial Results Conference Call. At this time, all participants are in a listen-only mode. Later, we will conduct a question-and-answer session, and […] |
Funko Inc (FNKO) Reports Q3 2023 Earnings: Net Sales Down 14.4% YoY, Net Loss of $15.0 MillionDespite the challenges, Funko's Q3 results exceeded expectations with strong direct-to-consumer sales and cost reduction efforts |
FNKO Price Returns
1-mo | -14.52% |
3-mo | -19.28% |
6-mo | -18.43% |
1-year | -27.69% |
3-year | -66.83% |
5-year | -71.27% |
YTD | -19.28% |
2023 | -29.15% |
2022 | -41.97% |
2021 | 81.12% |
2020 | -39.51% |
2019 | 30.49% |
Continue Researching FNKO
Want to do more research on Funko Inc's stock and its price? Try the links below:Funko Inc (FNKO) Stock Price | Nasdaq
Funko Inc (FNKO) Stock Quote, History and News - Yahoo Finance
Funko Inc (FNKO) Stock Price and Basic Information | MarketWatch
Loading social stream, please wait...