
Amicus Therapeutics, Inc. (FOLD): Price and Financial Metrics
FOLD Price/Volume Stats
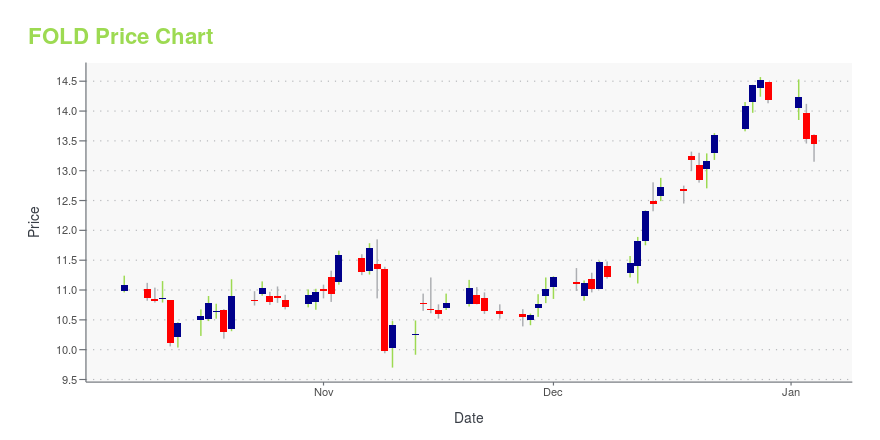
| Current price | $10.18 | 52-week high | $14.57 |
| Prev. close | $10.26 | 52-week low | $9.02 |
| Day low | $10.09 | Volume | 3,643,600 |
| Day high | $10.44 | Avg. volume | 2,813,550 |
| 50-day MA | $10.07 | Dividend yield | N/A |
| 200-day MA | $11.36 | Market Cap | 3.02B |
FOLD Stock Price Chart Interactive Chart >
Amicus Therapeutics, Inc. (FOLD) Company Bio
Amicus Therapeutics is developing treatments for a broad range of human genetic diseases, with a focus on delivering new benefits to individuals with lysosomal storage disorders. The company was founded in 2002 and is based in Cranbury, New Jersey.
Latest FOLD News From Around the Web
Below are the latest news stories about AMICUS THERAPEUTICS INC that investors may wish to consider to help them evaluate FOLD as an investment opportunity.
‘Time to Pull the Trigger,’ Says Morgan Stanley About These 2 Healthcare StocksIt’s been a bountiful year for the stock market but that doesn’t mean there haven’t been laggards. The biotech industry, for example, has underperformed. While the Nasdaq Biotechnology Index (NBI) shows a 3% year-to-date gain, that is still some distance below the S&P 500’s 24% return. Therefore, with investor sentiment subdued, and some SMID-cap biotech firms still needing to raise capital against a challenging capital markets backdrop, Morgan Stanley’s Jeffrey Hung says the setup for SMID-cap |
Amicus Therapeutics Inc's Chief Development Officer Sells SharesOn December 20, 2023, Jeff Castelli, Chief Development Officer of Amicus Therapeutics Inc (NASDAQ:FOLD), sold 19,154 shares of the company, according to a recent SEC Filing. |
Why Is Amicus Therapeutics (FOLD) Up 15% Since Last Earnings Report?Amicus Therapeutics (FOLD) reported earnings 30 days ago. What's next for the stock? We take a look at earnings estimates for some clues. |
BIO names longtime Amicus head John Crowley as new CEOCrowley, a rare disease advocate who led Amicus for nearly two decades, will take the reins as the industry group seeks to challenge Medicare’s new drug pricing powers. |
Amicus Therapeutics Congratulates Executive Chairman John F. Crowley on Appointment as Next President and CEO of BIOCrowley to Step Down from Amicus Board of Directors in March 2024 and Become Amicus Chairman Emeritus Michael Raab, Current Lead Independent Director, to Become Chairman of Amicus Board of Directors PRINCETON, N.J., Dec. 05, 2023 (GLOBE NEWSWIRE) -- Amicus Therapeutics (Nasdaq: FOLD) today announced that John F. Crowley, Executive Chairman of Amicus Therapeutics, will step down from the Amicus Board of Directors and assume the role of President and Chief Executive Officer of BIO, the Biotechnolo |
FOLD Price Returns
| 1-mo | 2.72% |
| 3-mo | -0.97% |
| 6-mo | -21.51% |
| 1-year | -24.98% |
| 3-year | 12.49% |
| 5-year | -20.34% |
| YTD | -28.26% |
| 2023 | 16.22% |
| 2022 | 5.71% |
| 2021 | -49.98% |
| 2020 | 137.06% |
| 2019 | 1.67% |
Continue Researching FOLD
Here are a few links from around the web to help you further your research on Amicus Therapeutics Inc's stock as an investment opportunity:Amicus Therapeutics Inc (FOLD) Stock Price | Nasdaq
Amicus Therapeutics Inc (FOLD) Stock Quote, History and News - Yahoo Finance
Amicus Therapeutics Inc (FOLD) Stock Price and Basic Information | MarketWatch
Loading social stream, please wait...