Fonar Corporation (FONR): Price and Financial Metrics
FONR Price/Volume Stats
Current price | $21.61 | 52-week high | $24.05 |
Prev. close | $21.89 | 52-week low | $12.13 |
Day low | $21.48 | Volume | 13,700 |
Day high | $21.90 | Avg. volume | 18,981 |
50-day MA | $20.98 | Dividend yield | N/A |
200-day MA | $17.80 | Market Cap | 136.75M |
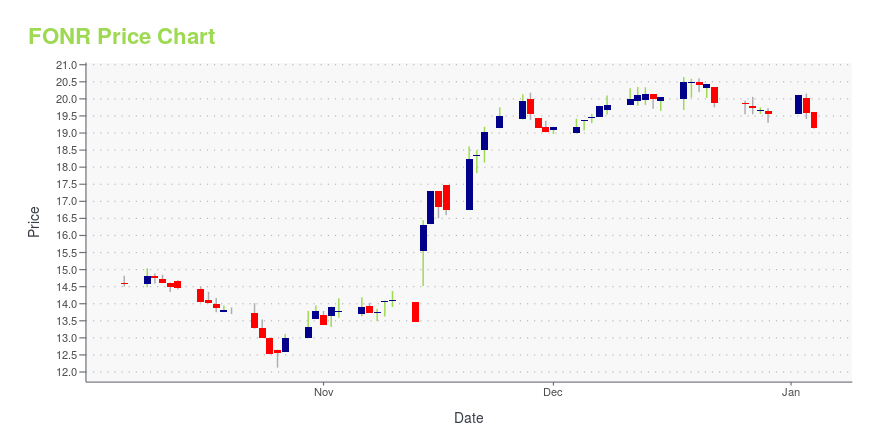
FONR Stock Price Chart Interactive Chart >
FONR POWR Grades
- FONR scores best on the Growth dimension, with a Growth rank ahead of 94.88% of US stocks.
- The strongest trend for FONR is in Stability, which has been heading down over the past 26 weeks.
- FONR's current lowest rank is in the Momentum metric (where it is better than 38.02% of US stocks).
FONR Stock Summary
- FONR's went public 30.21 years ago, making it older than 77.68% of listed US stocks we're tracking.
- Of note is the ratio of FONAR CORP's sales and general administrative expense to its total operating expenses; 78.72% of US stocks have a lower such ratio.
- FONR's equity multiplier -- a measure of assets relative to shareholders'equity -- is greater than that of only 15.71% of US stocks.
- Stocks with similar financial metrics, market capitalization, and price volatility to FONAR CORP are TRT, NSYS, PFIE, NVST, and TCMD.
- Visit FONR's SEC page to see the company's official filings. To visit the company's web site, go to www.fonar.com.
FONR Valuation Summary
- FONR's price/sales ratio is 1.3; this is 40.91% lower than that of the median Healthcare stock.
- Over the past 243 months, FONR's price/sales ratio has gone down 1.2.
Below are key valuation metrics over time for FONR.
Stock | Date | P/S | P/B | P/E | EV/EBIT |
---|---|---|---|---|---|
FONR | 2023-12-29 | 1.3 | 0.8 | 12.5 | 7.7 |
FONR | 2023-12-28 | 1.3 | 0.8 | 12.5 | 7.8 |
FONR | 2023-12-27 | 1.3 | 0.8 | 12.6 | 7.8 |
FONR | 2023-12-26 | 1.3 | 0.8 | 12.6 | 7.8 |
FONR | 2023-12-22 | 1.3 | 0.8 | 12.7 | 7.8 |
FONR | 2023-12-21 | 1.4 | 0.9 | 13.0 | 8.1 |
FONR Growth Metrics
- The year over year cash and equivalents growth rate now stands at 12.74%.
- Its 3 year net income to common stockholders growth rate is now at -46.82%.
- The 2 year net cashflow from operations growth rate now stands at -20.66%.
The table below shows FONR's growth in key financial areas (numbers in millions of US dollars).
Date | Revenue | Operating Cash Flow | Net Income to Common Stock |
---|---|---|---|
2022-12-31 | 96.83015 | 15.36836 | 8.281796 |
2022-09-30 | 97.05315 | 16.75736 | 9.961796 |
2022-06-30 | 97.59215 | 15.30136 | 11.6908 |
2022-03-31 | 97.47576 | 16.065 | 10.25913 |
2021-12-31 | 95.99477 | 15.331 | 11.74013 |
2021-09-30 | 92.68076 | 16.547 | 10.88913 |
FONR's Quality Factors
The “Quality” component of the POWR Ratings focuses on 31 different factors of a companies fundamentals and operational strength. Here are some key insights as we drill into the specifics of these quality attributes.- FONR has a Quality Grade of B, ranking ahead of 88.69% of graded US stocks.
- FONR's asset turnover comes in at 0.487 -- ranking 97th of 186 Medical Equipment stocks.
- SMLR, STXS, and BMRA are the stocks whose asset turnover ratios are most correlated with FONR.
The table below shows FONR's key quality metrics over time.
Period | Asset Turnover | Gross Margin | ROIC |
---|---|---|---|
2021-06-30 | 0.487 | 0.483 | 0.095 |
2021-03-31 | 0.472 | 0.503 | 0.077 |
2020-12-31 | 0.474 | 0.508 | 0.066 |
2020-09-30 | 0.482 | 0.505 | 0.064 |
2020-06-30 | 0.497 | 0.495 | 0.069 |
2020-03-31 | 0.543 | 0.477 | 0.094 |
Fonar Corporation (FONR) Company Bio
Fonar Corporation engages in the design, manufacture, sale, and servicing of magnetic resonance imaging (MRI) scanners for the detection and diagnosis of human diseases, abnormalities, and other medical conditions and injuries. It operates in two segments, Medical Equipment, and Physician and Diagnostic Services Management. The company was founded in 1978 and is based in Melville, New York.
Latest FONR News From Around the Web
Below are the latest news stories about FONAR CORP that investors may wish to consider to help them evaluate FONR as an investment opportunity.
Calculating The Intrinsic Value Of FONAR Corporation (NASDAQ:FONR)Key Insights Using the 2 Stage Free Cash Flow to Equity, FONAR fair value estimate is US$22.42 FONAR's US$20.15 share... |
Is Now The Time To Put FONAR (NASDAQ:FONR) On Your Watchlist?For beginners, it can seem like a good idea (and an exciting prospect) to buy a company that tells a good story to... |
Individual investors who hold 51% of FONAR Corporation (NASDAQ:FONR) gained 23%, institutions profited as wellKey Insights The considerable ownership by individual investors in FONAR indicates that they collectively have a... |
Fonar Corp (FONR) Reports Substantial Growth in Q1 Fiscal 2024 EarningsNet Income Soars by 102%, Highlighting Strong Start to Fiscal Year |
Fonar Announces Financial Results for the 1st Quarter of Fiscal 2024On September 13, 2022, the Company adopted a stock repurchase plan of up to $9 million. At September 30, 2023, the Company has purchased 146,359 shares at a cost of $2,473,215.Total MRI scan volume at the HMCA-managed sites increased 14% to 50,744 scans for the quarter ending September 30, 2023 versus the corresponding quarter one year earlier. Cash and cash equivalents increased 1% to $51.7 million at September 30, 2023 as compared to the ... |
FONR Price Returns
1-mo | -6.17% |
3-mo | 5.93% |
6-mo | 35.66% |
1-year | 36.43% |
3-year | 19.33% |
5-year | -3.83% |
YTD | 10.48% |
2023 | 16.78% |
2022 | 11.82% |
2021 | -13.71% |
2020 | -11.83% |
2019 | -2.72% |
Continue Researching FONR
Want to see what other sources are saying about Fonar Corp's financials and stock price? Try the links below:Fonar Corp (FONR) Stock Price | Nasdaq
Fonar Corp (FONR) Stock Quote, History and News - Yahoo Finance
Fonar Corp (FONR) Stock Price and Basic Information | MarketWatch
Loading social stream, please wait...