
Five Point Holdings, LLC Class A Common Shares (FPH): Price and Financial Metrics
FPH Price/Volume Stats
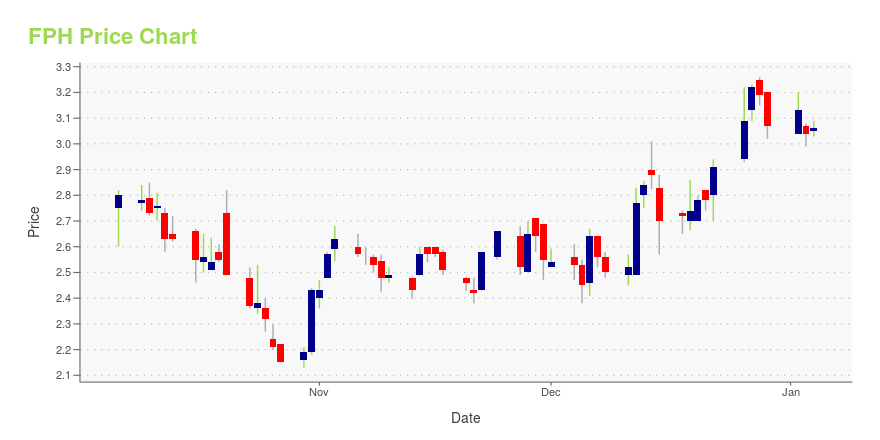
| Current price | $3.35 | 52-week high | $3.60 |
| Prev. close | $3.21 | 52-week low | $2.13 |
| Day low | $3.23 | Volume | 128,507 |
| Day high | $3.37 | Avg. volume | 82,941 |
| 50-day MA | $3.09 | Dividend yield | N/A |
| 200-day MA | $2.97 | Market Cap | 496.77M |
FPH Stock Price Chart Interactive Chart >
Five Point Holdings, LLC Class A Common Shares (FPH) Company Bio
Five Point Holdings, LLC, through its subsidiary, Five Point Operating Company, LLC, plans and develops mixed-use, master-planned communities in coastal California, the United States. It sells residential and commercial land sites to homebuilders, commercial developers, and commercial buyers. The company was founded in 2009 and is based in Aliso Viejo, California.
Latest FPH News From Around the Web
Below are the latest news stories about FIVE POINT HOLDINGS LLC that investors may wish to consider to help them evaluate FPH as an investment opportunity.
Five Point Holdings, LLC Announces Early Participation Deadline Results for the Previously Announced Exchange Offer and Consent SolicitationIRVINE, Calif., December 23, 2023--Five Point Holdings, LLC ("Five Point" or the "Company") (NYSE: FPH) today announced the early participation results of the previously announced exchange offer and consent solicitation by Five Point Operating Company, LP, through which Five Point owns all of its assets and conducts all of its operations (the "Issuer"), and Five Point Capital Corp., a wholly owned subsidiary of the Issuer (together with the Issuer, the "Issuers"), to Eligible Holders to exchange |
Five Point Holdings, LLC Announces Commencement of Exchange Offer and Consent SolicitationIRVINE, Calif., December 11, 2023--Five Point Holdings, LLC ("Five Point" or the "Company") (NYSE: FPH) today announced that Five Point Operating Company, LP, through which Five Point owns all of its assets and conducts all of its operations (the "Issuer"), and Five Point Capital Corp., a wholly owned subsidiary of the Issuer (together with the Issuer, the "Issuers"), commenced an offer to Eligible Holders (as defined herein) to exchange (such offer, the "Exchange Offer") any and all of the Issu |
Five Point Holdings' (NYSE:FPH) earnings trajectory could turn positive as the stock pops 22% this past weekFive Point Holdings, LLC ( NYSE:FPH ) shareholders should be happy to see the share price up 22% in the last week. But... |
Five Point Holdings, LLC (NYSE:FPH) Q3 2023 Earnings Call TranscriptFive Point Holdings, LLC (NYSE:FPH) Q3 2023 Earnings Call Transcript October 19, 2023 Operator: Greetings and welcome to the Five Point Holdings LLC Third Quarter 2023 Conference Call. As a reminder this call is being recorded. Today’s conference may include forward-looking statements regarding Five Point business financial condition, operations, cash flow, strategy, and perspectives. Forward-looking […] |
Q3 2023 Five Point Holdings LLC Earnings CallQ3 2023 Five Point Holdings LLC Earnings Call |
FPH Price Returns
| 1-mo | 12.79% |
| 3-mo | 15.92% |
| 6-mo | 0.00% |
| 1-year | -1.47% |
| 3-year | -58.64% |
| 5-year | -55.51% |
| YTD | 9.12% |
| 2023 | 31.76% |
| 2022 | -64.37% |
| 2021 | 19.78% |
| 2020 | -21.44% |
| 2019 | 0.14% |
Continue Researching FPH
Want to do more research on Five Point Holdings LLC's stock and its price? Try the links below:Five Point Holdings LLC (FPH) Stock Price | Nasdaq
Five Point Holdings LLC (FPH) Stock Quote, History and News - Yahoo Finance
Five Point Holdings LLC (FPH) Stock Price and Basic Information | MarketWatch
Loading social stream, please wait...