
Farmland Partners Inc. (FPI): Price and Financial Metrics
FPI Price/Volume Stats
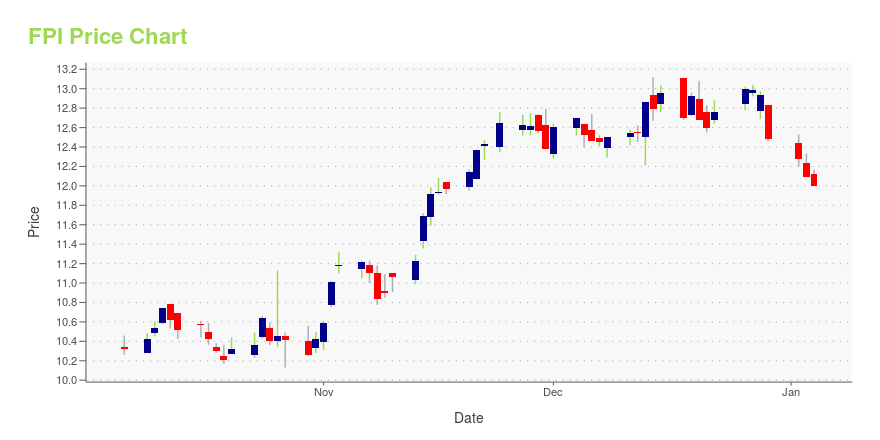
| Current price | $10.46 | 52-week high | $13.27 |
| Prev. close | $10.57 | 52-week low | $9.95 |
| Day low | $10.34 | Volume | 529,500 |
| Day high | $10.64 | Avg. volume | 328,273 |
| 50-day MA | $11.25 | Dividend yield | 2.09% |
| 200-day MA | $11.31 | Market Cap | 503.83M |
FPI Stock Price Chart Interactive Chart >
Farmland Partners Inc. (FPI) Company Bio
Farmland Partners owns and operates farmland located in agricultural markets throughout North America. The company was founded in 2013 and is based in Westminster, Colorado.
Latest FPI News From Around the Web
Below are the latest news stories about FARMLAND PARTNERS INC that investors may wish to consider to help them evaluate FPI as an investment opportunity.
5 REITs Paying Special Dividends With Upcoming Ex-Dividend DatesAs much as investors love regular dividend payments, it's even more "special" when one of their stocks pays a special dividend, most often at the end of the calendar year. Because real estate investment trusts (REITs) are required to pay shareholders 90% or more of taxable income each year, special dividend distributions are often required when a REIT disposes of assets with large gains, which increases the taxable income for that year. The special dividend benefits shareholders with a larger an |
Who Owns More Farmland: Bill Gates Or Farmland Partners?Bill Gates is best known for cofounding the software giant Microsoft Corp. With a net worth of somewhere in the range of $118 billion, it's safe to say that he has done well for himself. But there's something else you may not know. Gates has had great success investing outside of the tech industry. For example, he owns quite a bit of farmland in the United States. That's right. One of the top tech titans over the past 40+ years has invested heavily in farmland. How Much Farmland Does Bill Gates |
Colorado Greenhouse and Ranch Go to Market in Ag-Sector Real Estate SaleA&G Real Estate Partners and Murray Wise Associates LLC are now accepting sealed-bid offers for Spring Born's fully automated, approximately 165,000-square-foot hydroponic growing operations and 254-acre ranch near Silt and I-70 in western Colorado. |
Farmland Partners Asset Appreciation Leads to Declaration of $0.21 per Share Special DividendDENVER, December 12, 2023--Farmland Partners Inc. (NYSE: FPI) (the "Company" or "FPI") today announced that its Board of Directors has declared a one-time dividend of $0.21 per share of common stock and Class A Common OP Unit, payable in cash on January 12, 2024 to shareholders of record on December 29, 2023. |
MWA Auctions Illinois Farm for $14.9 MillionCHAMPAIGN, Ill., December 04, 2023--Murray Wise Associates (MWA) announced today that it recently helped a client secure $14.9 million for 860 acres of farmland in Moultrie, Piatt, and Douglas Counties, Illinois. |
FPI Price Returns
| 1-mo | -8.00% |
| 3-mo | -3.00% |
| 6-mo | -7.42% |
| 1-year | -7.18% |
| 3-year | -10.61% |
| 5-year | 96.20% |
| YTD | -15.28% |
| 2023 | 3.99% |
| 2022 | 6.09% |
| 2021 | 39.70% |
| 2020 | 32.09% |
| 2019 | 53.85% |
FPI Dividends
| Ex-Dividend Date | Type | Payout Amount | Change | ||||||
|---|---|---|---|---|---|---|---|---|---|
| Loading, please wait... | |||||||||
Continue Researching FPI
Want to do more research on Farmland Partners Inc's stock and its price? Try the links below:Farmland Partners Inc (FPI) Stock Price | Nasdaq
Farmland Partners Inc (FPI) Stock Quote, History and News - Yahoo Finance
Farmland Partners Inc (FPI) Stock Price and Basic Information | MarketWatch
Loading social stream, please wait...