
Fiesta Restaurant Group, Inc. (FRGI): Price and Financial Metrics
FRGI Price/Volume Stats
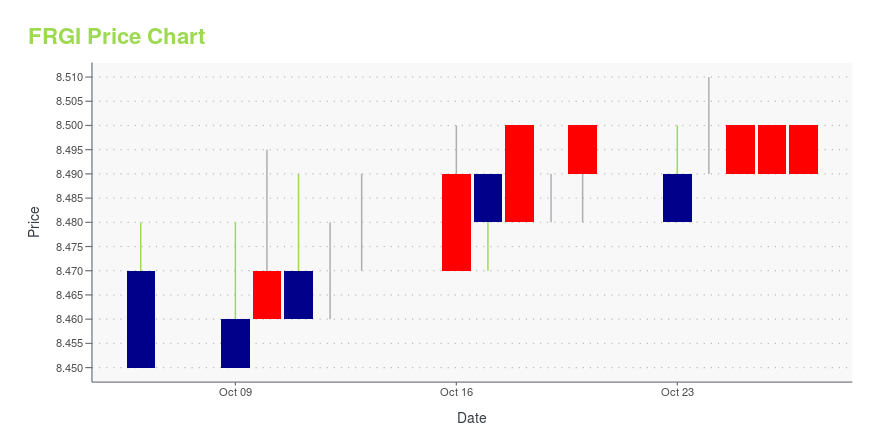
| Current price | $8.49 | 52-week high | $9.28 |
| Prev. close | $8.49 | 52-week low | $6.00 |
| Day low | $8.49 | Volume | 501,700 |
| Day high | $8.50 | Avg. volume | 138,104 |
| 50-day MA | $8.44 | Dividend yield | N/A |
| 200-day MA | $8.19 | Market Cap | 222.34M |
FRGI Stock Price Chart Interactive Chart >
Fiesta Restaurant Group, Inc. (FRGI) Company Bio
Fiesta Restaurant Group owns, operates, and franchises its fast-casual restaurants under the Pollo Tropical and Taco Cabana brand names. The company was founded in 2011 and is based in Addison, Texas.
Latest FRGI News From Around the Web
Below are the latest news stories about FIESTA RESTAURANT GROUP INC that investors may wish to consider to help them evaluate FRGI as an investment opportunity.
Fiesta Restaurant Group Announces Expiration of "Go-Shop" PeriodDALLAS, September 06, 2023--Fiesta Restaurant Group, Inc. ("Fiesta" or the "Company") (NASDAQ: FRGI), parent company of the Pollo Tropical® restaurant brand, today announced the expiration of the 30-day "go-shop" period under the terms of the previously announced merger agreement pursuant to which Authentic Restaurant Brands ("ARB"), a portfolio company of Garnett Station Partners, LLC ("Garnett Station" or "GSP"), will acquire Fiesta in an all-cash transaction. The "go-shop" period expired at 1 |
Jefferies Group Reduces Stake in Fiesta Restaurant Group IncFirm real-time pick highlight |
Fiesta Restaurant Group, Inc. Reports Second Quarter 2023 ResultsDALLAS, August 07, 2023--Fiesta Restaurant Group, Inc. ("Fiesta" or the "Company") (NASDAQ: FRGI), parent company of the Pollo Tropical® restaurant brand, today reported results for the 13-week second quarter, which ended on July 2, 2023 and provided a business update related to current operations. |
Fiesta Restaurant Group, Inc. to be Acquired by Authentic Restaurant BrandsDALLAS & NEW YORK, August 07, 2023--Fiesta Restaurant Group, Inc. ("Fiesta" or the "Company") (NASDAQ: FRGI), parent company of the Pollo Tropical® restaurant brand, and Authentic Restaurant Brands ("ARB"), a portfolio company of Garnett Station Partners, LLC ("Garnett Station" or "GSP"), a New York-based principal investment firm, today announced that they have entered into a definitive agreement under which a wholly owned subsidiary of ARB will acquire the Company in an all cash transaction. |
PRESS DIGEST- Wall Street Journal - August 7The following are the top stories in the Wall Street Journal. - U.S. trucking firm Yellow Corp filed for Chapter 11 bankruptcy protection on Sunday, burdened with a heavy debt load after a series of mergers and following tense contract negotiations with the Teamsters Union. - The parent company of Pollo Tropical restaurant chain, Fiesta Restaurant Group, is nearing a deal to be bought by Authentic Restaurant Brands, part of New York-based Garnett Station Partners for $225 million. |
FRGI Price Returns
| 1-mo | N/A |
| 3-mo | N/A |
| 6-mo | N/A |
| 1-year | 11.42% |
| 3-year | -38.92% |
| 5-year | -18.44% |
| YTD | N/A |
| 2023 | 0.00% |
| 2022 | -33.24% |
| 2021 | -3.42% |
| 2020 | 15.27% |
| 2019 | -36.23% |
Continue Researching FRGI
Want to see what other sources are saying about Fiesta Restaurant Group Inc's financials and stock price? Try the links below:Fiesta Restaurant Group Inc (FRGI) Stock Price | Nasdaq
Fiesta Restaurant Group Inc (FRGI) Stock Quote, History and News - Yahoo Finance
Fiesta Restaurant Group Inc (FRGI) Stock Price and Basic Information | MarketWatch
Loading social stream, please wait...