
Flexible Solutions International Inc. (CDA) (FSI): Price and Financial Metrics
FSI Price/Volume Stats
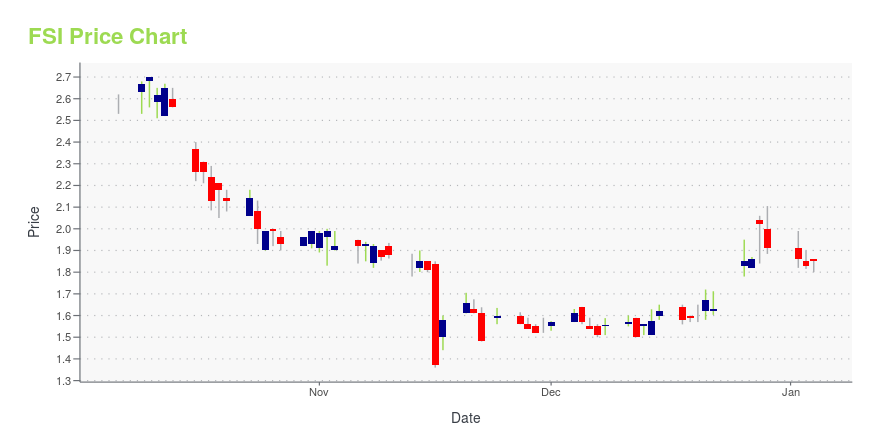
| Current price | $2.10 | 52-week high | $2.96 |
| Prev. close | $2.01 | 52-week low | $1.36 |
| Day low | $2.03 | Volume | 26,383 |
| Day high | $2.10 | Avg. volume | 26,715 |
| 50-day MA | $1.99 | Dividend yield | N/A |
| 200-day MA | $1.93 | Market Cap | 26.15M |
FSI Stock Price Chart Interactive Chart >
Flexible Solutions International Inc. (CDA) (FSI) Company Bio
Flexible Solutions International Inc., together with its subsidiaries, develops, manufactures, and markets specialty chemicals that slow the evaporation of water in Canada, the United States, and internationally. The company operates in two segments, Energy and Water Conservation Products, and Biodegradable Polymers. The company offers thermal polyaspartates (TPAs) for oilfields to reduce scale and corrosion in various water systems; and for the agricultural industry to reduce fertilizer crystallization before, during, and after application, as well as to prevent crystal formation between fertilizer and minerals present in the soil. It also provides TPAs for irrigation to prevent early plugging of drip irrigation ports, reduce maintenance costs, and lengthen the life of equipment; and TPAs as additives for household laundry detergents, consumer care products, and pesticides. In addition, the company offers nitrogen conservation products for agriculture that slow down nitrogen loss from fields. Further, it provides HEATSAVR, a chemical product for use in swimming pools and spas that forms a thin and transparent layer on the water's surface; and WATERSAVR to reduce water evaporation in reservoirs, potable water storage tanks, livestock watering ponds, aqueducts, canals, and irrigation ditches, as well as for lawn and turf care, and potted and bedding plants. The company is headquartered in Taber, Canada.
Latest FSI News From Around the Web
Below are the latest news stories about FLEXIBLE SOLUTIONS INTERNATIONAL INC that investors may wish to consider to help them evaluate FSI as an investment opportunity.
7 F-Rated Consumer Discretionary Stocks to Ditch in DecemberConsumers are usually pretty free-spending over the holidays, but they consistently turn away from these consumer discretionary stocks. |
Flexible Solutions International, Inc. (AMEX:FSI) Q3 2023 Earnings Call TranscriptFlexible Solutions International, Inc. (AMEX:FSI) Q3 2023 Earnings Call Transcript November 18, 2023 Operator: Good day, everyone, and welcome to today’s Flexible Solutions International Third Quarter 2023 Financials Conference. At this time, all participants are in a listen-only mode. Later, you will have the opportunity to ask questions during the question-and-answer session. [Operator Instructions] Please […] |
Insider Sell Alert: CEO O BRIEN DANIEL B Unloads Shares of Flexible Solutions International IncIn a notable insider transaction, CEO O BRIEN DANIEL B has sold a significant number of shares in Flexible Solutions International Inc (FSI), a move that has caught the attention of investors and market analysts. |
Flexible Solutions (FSI) Q3 Earnings and Sales Miss EstimatesLower customer orders and reduced pricing hurt sales in Flexible Solutions' (FSI) Biodegradable Polymers unit in Q3. |
Flexible Solutions International Inc. (FSI) Reports Q3 Loss, Lags Revenue EstimatesFlexible Solutions International Inc. (FSI) delivered earnings and revenue surprises of -166.67% and 26.90%, respectively, for the quarter ended September 2023. Do the numbers hold clues to what lies ahead for the stock? |
FSI Price Returns
| 1-mo | 18.64% |
| 3-mo | -4.11% |
| 6-mo | 17.32% |
| 1-year | -25.53% |
| 3-year | -48.78% |
| 5-year | -33.08% |
| YTD | 9.95% |
| 2023 | -38.39% |
| 2022 | -20.31% |
| 2021 | 56.22% |
| 2020 | -3.11% |
| 2019 | 103.47% |
Continue Researching FSI
Want to do more research on Flexible Solutions International Inc's stock and its price? Try the links below:Flexible Solutions International Inc (FSI) Stock Price | Nasdaq
Flexible Solutions International Inc (FSI) Stock Quote, History and News - Yahoo Finance
Flexible Solutions International Inc (FSI) Stock Price and Basic Information | MarketWatch
Loading social stream, please wait...