Fisker Inc. (FSR): Price and Financial Metrics
FSR Price/Volume Stats
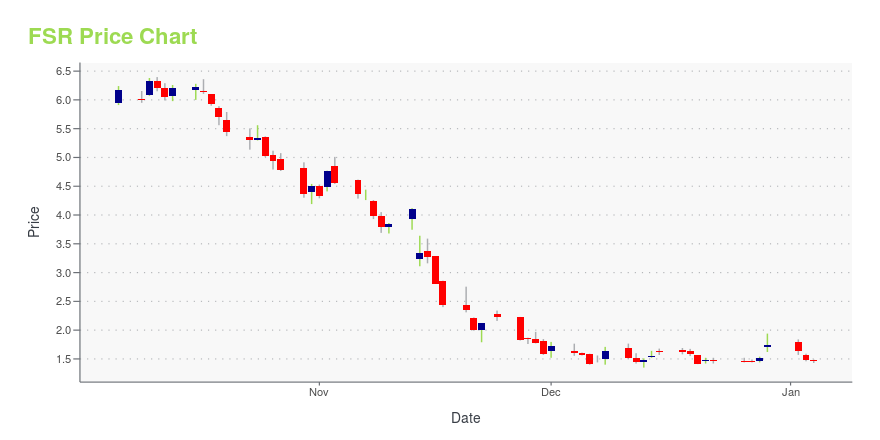
Current price | $6.16 | 52-week high | $11.41 |
Prev. close | $6.14 | 52-week low | $4.26 |
Day low | $6.13 | Volume | 3,676,700 |
Day high | $6.35 | Avg. volume | 7,660,668 |
50-day MA | $5.84 | Dividend yield | N/A |
200-day MA | $7.10 | Market Cap | 2.03B |
FSR Stock Price Chart Interactive Chart >
FSR POWR Grades
- FSR scores best on the Growth dimension, with a Growth rank ahead of 85.79% of US stocks.
- FSR's strongest trending metric is Growth; it's been moving up over the last 179 days.
- FSR ranks lowest in Sentiment; there it ranks in the 0th percentile.
FSR Stock Summary
- The capital turnover (annual revenue relative to shareholder's equity) for FSR is 0 -- better than just 8.47% of US stocks.
- With a price/sales ratio of 4,247, FISKER INC has a higher such ratio than 99.85% of stocks in our set.
- Revenue growth over the past 12 months for FISKER INC comes in at 455.79%, a number that bests 98.22% of the US stocks we're tracking.
- Stocks that are quantitatively similar to FSR, based on their financial statements, market capitalization, and price volatility, are XENE, GERN, RXDX, ALLO, and VTVT.
- FSR's SEC filings can be seen here. And to visit FISKER INC's official web site, go to www.fiskerinc.com.
FSR Valuation Summary
- In comparison to the median Consumer Cyclical stock, FSR's price/sales ratio is 214305.56% higher, now standing at 3859.3.
- FSR's price/earnings ratio has moved NA NA over the prior 58 months.
Below are key valuation metrics over time for FSR.
Stock | Date | P/S | P/B | P/E | EV/EBIT |
---|---|---|---|---|---|
FSR | 2023-05-19 | 3859.3 | 5.0 | -3.7 | -4.0 |
FSR | 2023-05-18 | 3909.3 | 5.1 | -3.8 | -4.0 |
FSR | 2023-05-17 | 4003.0 | 5.2 | -3.9 | -4.1 |
FSR | 2023-05-16 | 3815.3 | 4.9 | -3.7 | -3.9 |
FSR | 2023-05-15 | 3940.5 | 5.1 | -3.8 | -4.0 |
FSR | 2023-05-12 | 3809.1 | 4.9 | -3.7 | -3.9 |
FSR's Quality Factors
The “Quality” component of the POWR Ratings focuses on 31 different factors of a companies fundamentals and operational strength. Here are some key insights as we drill into the specifics of these quality attributes.- FSR has a Quality Grade of D, ranking ahead of 24.64% of graded US stocks.
- FSR's asset turnover comes in at 0 -- ranking 61st of 68 Automobiles and Trucks stocks.
- 500 - Internal server error
The table below shows FSR's key quality metrics over time.
Period | Asset Turnover | Gross Margin | ROIC |
---|---|---|---|
2021-06-30 | 0 | 0.367 | -2.432 |
2021-03-31 | 0 | 0.227 | -1.084 |
2020-12-31 | 0 | NA | -0.124 |
2020-09-30 | 0 | NA | -0.068 |
2020-09-30 | 0 | NA | 0.005 |
2020-06-30 | 0 | NA | 0.015 |
FSR Price Target
For more insight on analysts targets of FSR, see our FSR price target page. And for a list of of all stocks sorted by upside potential based on analyst target price, see our Top Price Target page.
Average Price Target | $22.22 | Average Broker Recommendation | 1.68 (Moderate Buy) |
Fisker Inc. (FSR) Company Bio
Fisker, Inc. operates in the automotive industry that develops eco-friendly electric vehicles. The company is based in Manhattan Beach, California.
Latest FSR News From Around the Web
Below are the latest news stories about FISKER INC that investors may wish to consider to help them evaluate FSR as an investment opportunity.
CRWD Stock Alert: CrowdStrike Announces New Partnership With Pax8CrowdStrike (CRWD) stock is on the move Thursday after announcing a new partnership with cloud commerce marketplace Pax8. |
LI Stock Alert: Li Auto Announces 28,277 DeliveriesLi Auto (LI) stock is a hot topic among green energy vehicle investors with its 28.2777 deliveries for the month of May 2023! |
Why Is Fisker (FSR) Stock Up 3% Today?Fisker (FSR) stock is getting a boost on Thursday as investors react to good news concerning the range of the Fisker Ocean Extreme. |
XPEV Stock Alert: Xpeng Announces 7,506 DeliveriesXpeng (XPEV) stock is on the move Thursday after the EV company announced the delivery of 7,506 EVs during the month of May 2023. |
3 SPAC Stocks That Still Have Huge Upside Potential in 2023These top SPAC stocks to buy are still in the early stages of development, but offer impressive upside potential over the long-term. |
FSR Price Returns
1-mo | 5.84% |
3-mo | -19.37% |
6-mo | -16.53% |
1-year | -36.56% |
3-year | -40.14% |
5-year | N/A |
YTD | -15.27% |
2022 | -53.78% |
2021 | 7.37% |
2020 | 44.08% |
2019 | N/A |
2018 | N/A |
Loading social stream, please wait...