Fortinet Inc. (FTNT): Price and Financial Metrics

Fortinet Inc. (FTNT): $52.61

0.99 (-1.85%)

POWR Rating

Component Grades

Momentum

C

Stability

C

Sentiment

Quality

A

Add FTNT to Watchlist
Sign Up

Industry: Software - Security

Industry

B

Ranked

#7 of 22

in industry

FTNT Price/Volume Stats
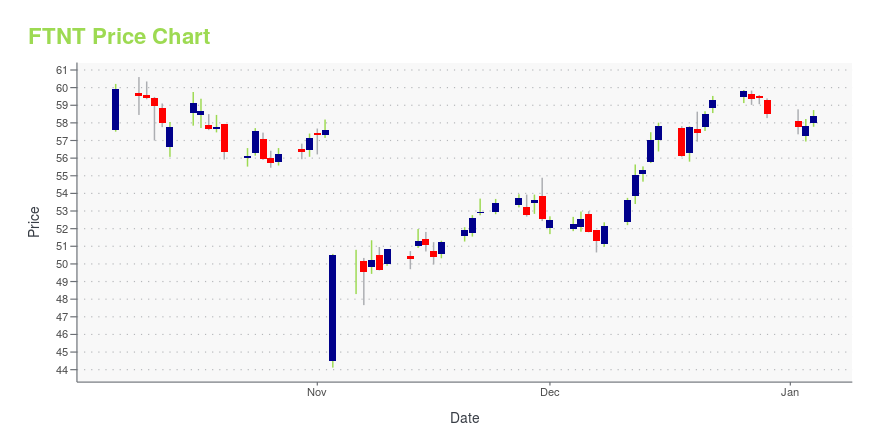
Current price $52.61 52-week high $81.24
Prev. close $53.60 52-week low $44.12
Day low $52.51 Volume 2,925,190
Day high $54.89 Avg. volume 5,783,422
50-day MA $55.45 Dividend yield N/A
200-day MA $63.58 Market Cap 40.40B

FTNT Stock Price Chart Interactive Chart >

FTNT POWR Grades

  • Quality is the dimension where FTNT ranks best; there it ranks ahead of 99.42% of US stocks.
  • The strongest trend for FTNT is in Stability, which has been heading down over the past 177 days.
  • FTNT ranks lowest in Growth; there it ranks in the 30th percentile.

FTNT Stock Summary

  • FORTINET INC's market capitalization of $39,025,166,024 is ahead of 94.07% of US-listed equities.
  • The capital turnover (annual revenue relative to shareholder's equity) for FTNT is 69.81 -- better than 99.68% of US stocks.
  • Equity multiplier, or assets relative to shareholders' equity, comes in at 224.03 for FORTINET INC; that's greater than it is for 99.88% of US stocks.
  • Stocks that are quantitatively similar to FTNT, based on their financial statements, market capitalization, and price volatility, are EAST, NCLH, BSIG, CLPR, and OPFI.
  • Visit FTNT's SEC page to see the company's official filings. To visit the company's web site, go to www.fortinet.com.

FTNT Valuation Summary

  • FTNT's price/earnings ratio is 37.4; this is 57.81% higher than that of the median Technology stock.
  • FTNT's EV/EBIT ratio has moved down 2.3 over the prior 170 months.

Below are key valuation metrics over time for FTNT.

Stock Date P/S P/B P/E EV/EBIT
FTNT 2023-11-03 7.9 123.4 37.4 32.9
FTNT 2023-11-02 9.1 140.8 42.7 37.7
FTNT 2023-11-01 9.0 140.1 42.5 37.5
FTNT 2023-10-31 9.0 139.8 42.4 37.4
FTNT 2023-10-30 8.9 137.7 41.8 36.8
FTNT 2023-10-27 8.9 137.6 41.7 36.8

FTNT Growth Metrics

    The 2 year price growth rate now stands at 97.14%.
  • The 5 year net cashflow from operations growth rate now stands at 147.05%.
  • Its 3 year cash and equivalents growth rate is now at -24.11%.
FTNT's revenue has moved up $1,941,800,000 over the prior 33 months.

The table below shows FTNT's growth in key financial areas (numbers in millions of US dollars).

Date Revenue Operating Cash Flow Net Income to Common Stock
2022-09-30 4,098 1,569.3 742.5
2022-06-30 3,815.7 1,485.1 674
2022-03-31 3,586.7 1,579.9 638
2021-12-31 3,342.2 1,499.7 606.8
2021-09-30 3,126.6 1,429.4 554.5
2021-06-30 2,910.5 1,251.4 514.8

FTNT's Quality Factors

The “Quality” component of the POWR Ratings focuses on 31 different factors of a companies fundamentals and operational strength. Here are some key insights as we drill into the specifics of these quality attributes.
  • FTNT has a Quality Grade of A, ranking ahead of 98.18% of graded US stocks.
  • FTNT's asset turnover comes in at 0.63 -- ranking 46th of 83 Computers stocks.
  • QBAK, HPQ, and SCKT are the stocks whose asset turnover ratios are most correlated with FTNT.

The table below shows FTNT's key quality metrics over time.

Period Asset Turnover Gross Margin ROIC
2021-06-30 0.630 0.777 0.328
2021-03-31 0.671 0.781 0.424
2020-12-31 0.732 0.780 0.594
2020-09-30 0.702 0.779 0.533
2020-06-30 0.674 0.776 0.507
2020-03-31 0.646 0.769 0.435

FTNT Price Target

For more insight on analysts targets of FTNT, see our FTNT price target page. And for a list of of all stocks sorted by upside potential based on analyst target price, see our Top Price Target page.

Average Price Target $296.32 Average Broker Recommendation 1.59 (Moderate Buy)

Fortinet Inc. (FTNT) Company Bio


Fortinet is an American multinational corporation headquartered in Sunnyvale, California. It develops and sells cybersecurity solutions, such as physical firewalls, antivirus software, intrusion prevention systems, and endpoint security components. (Source:Wikipedia)


FTNT Latest News Stream


Event/Time News Detail
Loading, please wait...

FTNT Latest Social Stream


Loading social stream, please wait...

View Full FTNT Social Stream

Latest FTNT News From Around the Web

Below are the latest news stories about FORTINET INC that investors may wish to consider to help them evaluate FTNT as an investment opportunity.

Nasdaq’s Hidden Deals: 3 Value Stocks to Buy Before the Rebound

Investors reeling from a volatile market since the summer can find great deals in these Nasdaq value stocks to buy today.

Rich Duprey on InvestorPlace | November 16, 2023

Get Massive Returns in 2024 With These Top 7 Undervalued Growth Stocks

Undervalued growth stocks offer higher margins of safety.

Marc Guberti on InvestorPlace | November 16, 2023

Fortinet (FTNT) Shares Sold Off on Missed Expectations

Conestoga Capital Advisors, an asset management company, released its “Mid Cap Strategy” third-quarter 2023 investor letter. A copy of the same can be downloaded here. The Mid Cap Composite declined 8.01% net of fees in the third quarter, trailing the Russell Midcap Growth Index’s -5.22% return. A combination of negative stock selection and sector allocation effects resulted […]

Yahoo | November 16, 2023

Palo Alto Networks Slips After Missing Billings Estimate

(Bloomberg) -- Cybersecurity firm Palo Alto Networks Inc. tumbled after missing Wall Street estimates for billings in its fiscal first quarter and lowering its estimates for the full year. Most Read from BloombergAston Martin Owner Lawrence Stroll Sells F1 Team Stake at £1 Billion ValuationBacklash Spreads Over Musk’s Endorsement of Antisemitic PostAltman Ousted From OpenAI, Board Says It Lost ConfidenceHamas Mastermind Who Tricked Israel Is Top Target in Gaza TunnelsApple Plans to Make It Easie

Yahoo | November 15, 2023

7 Must-Buy Stocks That Are on Ridiculous Discount Now

Given that this may be the year of artificial intelligence, it’s no surprise that while certain enterprises have hogged the spotlight, astute investors also enjoy compelling opportunities regarding stocks on sale.

Josh Enomoto on InvestorPlace | November 14, 2023

Read More 'FTNT' Stories Here

FTNT Price Returns

1-mo -7.98%
3-mo -13.57%
6-mo -22.78%
1-year -1.03%
3-year 113.46%
5-year 256.24%
YTD 7.61%
2022 -31.98%
2021 141.97%
2020 39.13%
2019 51.58%
2018 61.20%

Get Free Updates

Join thousands of investors who get the latest news, insights and top rated picks from StockNews.com!