Cedar Fair, L.P. (FUN): Price and Financial Metrics
FUN Price/Volume Stats
Current price | $41.45 | 52-week high | $45.93 |
Prev. close | $41.47 | 52-week low | $34.04 |
Day low | $41.37 | Volume | 69,167 |
Day high | $42.06 | Avg. volume | 222,919 |
50-day MA | $41.23 | Dividend yield | 2.92% |
200-day MA | $39.23 | Market Cap | 2.12B |
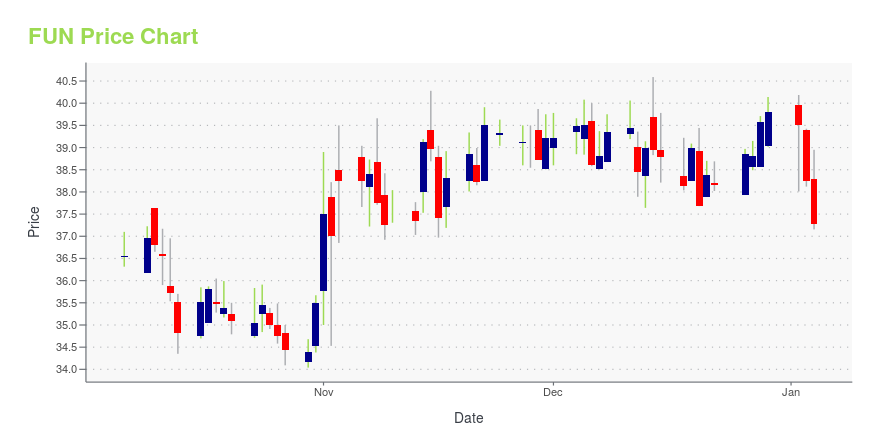
FUN Stock Price Chart Interactive Chart >
FUN POWR Grades
- Quality is the dimension where FUN ranks best; there it ranks ahead of 86.63% of US stocks.
- FUN's strongest trending metric is Quality; it's been moving up over the last 119 days.
- FUN's current lowest rank is in the Sentiment metric (where it is better than 31.48% of US stocks).
FUN Stock Summary
- The capital turnover (annual revenue relative to shareholder's equity) for FUN is -3.17 -- better than just 3.7% of US stocks.
- CEDAR FAIR L P's stock had its IPO on April 23, 1987, making it an older stock than 92.08% of US equities in our set.
- Equity multiplier, or assets relative to shareholders' equity, comes in at -3.35 for CEDAR FAIR L P; that's greater than it is for only 4.32% of US stocks.
- Stocks with similar financial metrics, market capitalization, and price volatility to CEDAR FAIR L P are SIX, SEAS, LBRDA, AVA, and KEX.
- FUN's SEC filings can be seen here. And to visit CEDAR FAIR L P's official web site, go to www.cedarfair.com.
FUN Valuation Summary
- In comparison to the median Consumer Cyclical stock, FUN's EV/EBIT ratio is 16.34% lower, now standing at 12.8.
- Over the past 243 months, FUN's EV/EBIT ratio has gone down 3.1.
Below are key valuation metrics over time for FUN.
Stock | Date | P/S | P/B | P/E | EV/EBIT |
---|---|---|---|---|---|
FUN | 2023-12-29 | 1.1 | -3.6 | 13.8 | 12.8 |
FUN | 2023-12-28 | 1.1 | -3.6 | 13.7 | 12.8 |
FUN | 2023-12-27 | 1.1 | -3.5 | 13.5 | 12.6 |
FUN | 2023-12-26 | 1.1 | -3.5 | 13.5 | 12.6 |
FUN | 2023-12-22 | 1.1 | -3.4 | 13.3 | 12.5 |
FUN | 2023-12-21 | 1.1 | -3.5 | 13.3 | 12.6 |
FUN Growth Metrics
- Its year over year net income to common stockholders growth rate is now at 94.51%.
- Its 2 year net income to common stockholders growth rate is now at -166.43%.
- Its 4 year net cashflow from operations growth rate is now at 0.96%.
The table below shows FUN's growth in key financial areas (numbers in millions of US dollars).
Date | Revenue | Operating Cash Flow | Net Income to Common Stock |
---|---|---|---|
2022-12-31 | 1,817.383 | 407.672 | 307.665 |
2022-09-30 | 1,802.325 | 383.531 | 268.091 |
2022-06-30 | 1,712.666 | 400.455 | 83.029 |
2022-03-31 | 1,427.312 | 196.239 | -26.611 |
2021-12-31 | 1,338.219 | 201.226 | -48.518 |
2021-09-30 | 1,021.16 | 89.043 | -126.751 |
FUN's Quality Factors
The “Quality” component of the POWR Ratings focuses on 31 different factors of a companies fundamentals and operational strength. Here are some key insights as we drill into the specifics of these quality attributes.- FUN has a Quality Grade of C, ranking ahead of 29.43% of graded US stocks.
- FUN's asset turnover comes in at 0.135 -- ranking 35th of 44 Entertainment stocks.
- LYV, MCS, and SEAS are the stocks whose asset turnover ratios are most correlated with FUN.
The table below shows FUN's key quality metrics over time.
Period | Asset Turnover | Gross Margin | ROIC |
---|---|---|---|
2021-06-27 | 0.135 | -0.245 | -0.069 |
2021-03-28 | 0.053 | -1.408 | -0.093 |
2020-12-31 | 0.071 | -1.070 | -0.132 |
2020-09-27 | 0.160 | -0.119 | -0.111 |
2020-06-28 | 0.401 | 0.393 | -0.018 |
2020-03-29 | 0.575 | 0.470 | 0.041 |
FUN Price Target
For more insight on analysts targets of FUN, see our FUN price target page. And for a list of of all stocks sorted by upside potential based on analyst target price, see our Top Price Target page.
Average Price Target | $61.89 | Average Broker Recommendation | 1.44 (Moderate Buy) |
Cedar Fair, L.P. (FUN) Company Bio
Cedar Fair LP owns and operates amusement and water parks, and hotels in the United States and Canada. The company was founded in 1983 and is based in Sandusky, Ohio.
Latest FUN News From Around the Web
Below are the latest news stories about CEDAR FAIR L P that investors may wish to consider to help them evaluate FUN as an investment opportunity.
Disney (DIS) Unveils Zootopia-Inspired Theme Park in ChinaDisney (DIS) launches Zootopia, the much-anticipated new land based on the Academy Award-winning Walt Disney Animation Studios film. |
Will Passenger Ticket Revenues Aid Carnival's (CCL) Q4 Earnings?Carnival's (CCL) fourth-quarter fiscal 2023 results are likely to benefit from robust passenger ticket revenues. |
Carnival (CCL) Gears Up for Q4 Earnings: What's in Store?Carnival's (CCL) fourth-quarter fiscal 2023 results are likely to reflect benefits from enhancements in booking trends and a strong pricing landscape. |
Royal Caribbean Cruises Ltd. (RCL) Hits Fresh High: Is There Still Room to Run?Royal Caribbean (RCL) is at a 52-week high, but can investors hope for more gains in the future? We take a look at the company's fundamentals for clues. |
Should Value Investors Buy Cedar Fair (FUN) Stock?Here at Zacks, our focus is on the proven Zacks Rank system, which emphasizes earnings estimates and estimate revisions to find great stocks. Nevertheless, we are always paying attention to the latest value, growth, and momentum trends to underscore strong picks. |
FUN Price Returns
1-mo | 3.40% |
3-mo | 4.88% |
6-mo | 13.68% |
1-year | -5.73% |
3-year | -9.91% |
5-year | -10.92% |
YTD | 4.88% |
2023 | -0.96% |
2022 | -16.23% |
2021 | 27.25% |
2020 | -27.49% |
2019 | 25.65% |
FUN Dividends
Ex-Dividend Date | Type | Payout Amount | Change | ||||||
---|---|---|---|---|---|---|---|---|---|
Loading, please wait... |
Continue Researching FUN
Here are a few links from around the web to help you further your research on Cedar Fair L P's stock as an investment opportunity:Cedar Fair L P (FUN) Stock Price | Nasdaq
Cedar Fair L P (FUN) Stock Quote, History and News - Yahoo Finance
Cedar Fair L P (FUN) Stock Price and Basic Information | MarketWatch
Loading social stream, please wait...