
Fusion Pharmaceuticals Inc. (FUSN): Price and Financial Metrics
FUSN Price/Volume Stats
| Current price | $21.55 | 52-week high | $21.60 |
| Prev. close | $21.52 | 52-week low | $2.31 |
| Day low | $21.45 | Volume | 6,089,100 |
| Day high | $21.59 | Avg. volume | 1,692,620 |
| 50-day MA | $21.39 | Dividend yield | N/A |
| 200-day MA | $10.42 | Market Cap | 1.83B |
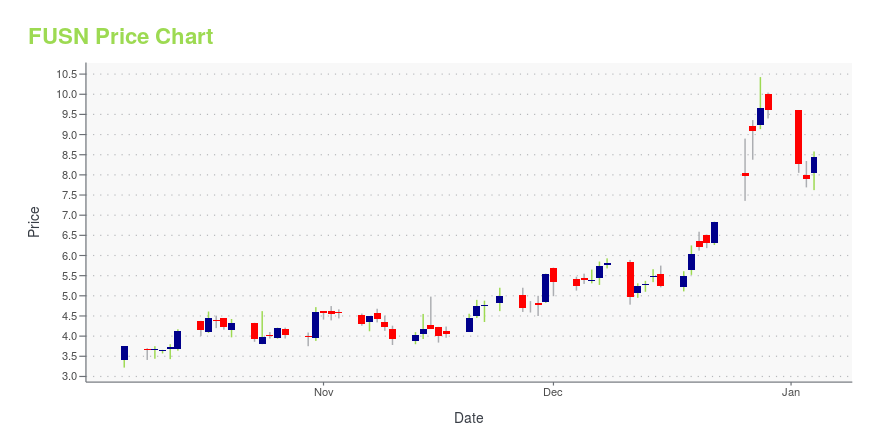
FUSN Stock Price Chart Interactive Chart >
Fusion Pharmaceuticals Inc. (FUSN) Company Bio
Fusion Pharmaceuticals, Inc. operates as a biopharmaceutical company. It develops GMP manufacturing of radiopharmaceuticals for the diagnosis and treatment of disease. The company was founded by John Vaillant and is headquartered in Hamilton, Canada.
Latest FUSN News From Around the Web
Below are the latest news stories about FUSION PHARMACEUTICALS INC that investors may wish to consider to help them evaluate FUSN as an investment opportunity.
Why Fusion Pharmaceuticals (FUSN) Stock Was Up 14% on WednesdayFusion Pharmaceuticals (FUSN) surges to a new record level 52-week high after analysts at Raymond James upgraded its rating following the buyout announcements for two comparable companies. |
Recent M&A Bodes Well For Targeted Cancer Therapy Player Fusion Pharmaceuticals, Analyst Say AstraZeneca Is Favorably PositionedWith recent merger and acquisition deals in the targeted radiopharmaceutical therapy (TRT) space, on Tuesday, Oppenheimer noted that Fusion Pharmaceuticals Inc (NASDAQ: FUSN) is potentially the sole remaining clinical-stage player with a robust supply chain. In September, Oppenheimer initiated coverage on Fusion Pharmaceuticals, citing the company's pipeline as among the best in the space with alpha-emitter-based targeted radionuclide therapies. Most recently, Bristol Myers Squibb & Co (NYSE: BM |
Gracell downgrade, Fusion upgrade: Wall Street's top analyst callsGracell downgrade, Fusion upgrade: Wall Street's top analyst calls |
4 Drug Stocks Rising More Than 40% in 2023 With Room to GrowNovo Nordisk (NVO), Journey Medical Corporation (DERM), Lyra Therapeutics (LYRA) and Fusion Pharmaceuticals (FUSN) have returned 40% or higher year to date and have room for more growth in 2024. |
Wall Street Analysts Predict a 149.52% Upside in Fusion Pharmaceuticals Inc. (FUSN): Here's What You Should KnowThe average of price targets set by Wall Street analysts indicates a potential upside of 149.5% in Fusion Pharmaceuticals Inc. (FUSN). While the effectiveness of this highly sought-after metric is questionable, the positive trend in earnings estimate revisions might translate into an upside in the stock. |
FUSN Price Returns
| 1-mo | N/A |
| 3-mo | 0.61% |
| 6-mo | 97.89% |
| 1-year | 543.28% |
| 3-year | 171.07% |
| 5-year | N/A |
| YTD | 124.25% |
| 2023 | 205.08% |
| 2022 | -24.46% |
| 2021 | -64.51% |
| 2020 | N/A |
| 2019 | N/A |
Loading social stream, please wait...