FVCBankcorp, Inc. (FVCB): Price and Financial Metrics
FVCB Price/Volume Stats
Current price | $11.52 | 52-week high | $16.74 |
Prev. close | $11.39 | 52-week low | $8.30 |
Day low | $11.12 | Volume | 54,800 |
Day high | $11.81 | Avg. volume | 43,066 |
50-day MA | $12.23 | Dividend yield | N/A |
200-day MA | $12.11 | Market Cap | 205.08M |
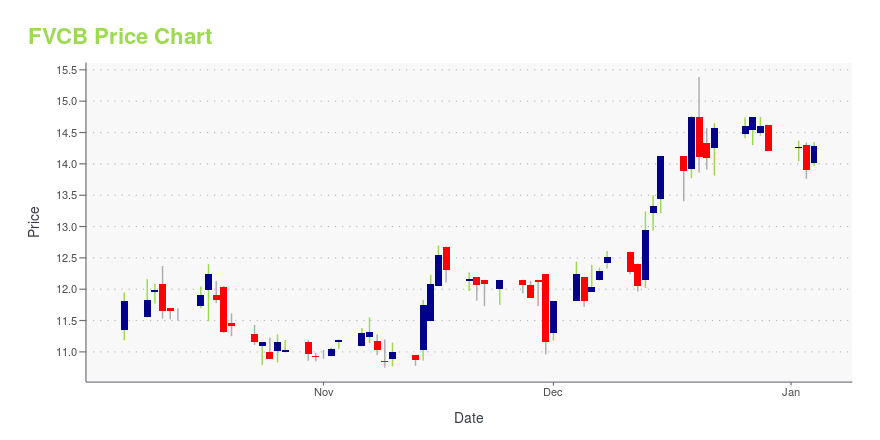
FVCB Stock Price Chart Interactive Chart >
FVCB POWR Grades
- FVCB scores best on the Sentiment dimension, with a Sentiment rank ahead of 89.14% of US stocks.
- FVCB's strongest trending metric is Quality; it's been moving up over the last 177 days.
- FVCB's current lowest rank is in the Value metric (where it is better than 12.75% of US stocks).
FVCB Stock Summary
- FVCB's equity multiplier -- a measure of assets relative to shareholders'equity -- is greater than that of 91.96% of US stocks.
- With a year-over-year growth in debt of -82.57%, FVCBANKCORP INC's debt growth rate surpasses just 2.06% of about US stocks.
- Shareholder yield, a measure of how much is returned to shareholders via dividends and share repurchases, for FVCB comes in at 69.79% -- higher than that of 97.3% of stocks in our set.
- Stocks with similar financial metrics, market capitalization, and price volatility to FVCBANKCORP INC are CFB, CALB, CBNK, BSVN, and PPBI.
- Visit FVCB's SEC page to see the company's official filings. To visit the company's web site, go to www.fvcbank.com.
FVCB Valuation Summary
- In comparison to the median Financial Services stock, FVCB's price/earnings ratio is 34.74% higher, now standing at 12.8.
- Over the past 61 months, FVCB's EV/EBIT ratio has gone down 9.6.
Below are key valuation metrics over time for FVCB.
Stock | Date | P/S | P/B | P/E | EV/EBIT |
---|---|---|---|---|---|
FVCB | 2023-09-15 | 3.8 | 1 | 12.8 | 8.2 |
FVCB | 2023-09-14 | 3.7 | 1 | 12.6 | 8.1 |
FVCB | 2023-09-13 | 3.8 | 1 | 12.7 | 8.1 |
FVCB | 2023-09-12 | 3.7 | 1 | 12.6 | 8.0 |
FVCB | 2023-09-11 | 3.7 | 1 | 12.5 | 8.0 |
FVCB | 2023-09-08 | 3.8 | 1 | 12.8 | 8.2 |
FVCB's Quality Factors
The “Quality” component of the POWR Ratings focuses on 31 different factors of a companies fundamentals and operational strength. Here are some key insights as we drill into the specifics of these quality attributes.- FVCB has a Quality Grade of C, ranking ahead of 32.03% of graded US stocks.
- FVCB's asset turnover comes in at 0.03 -- ranking 379th of 434 Banking stocks.
- 500 - Internal server error
The table below shows FVCB's key quality metrics over time.
Period | Asset Turnover | Gross Margin | ROIC |
---|---|---|---|
2021-06-30 | 0.030 | 1 | 0.014 |
2021-03-31 | 0.029 | 1 | 0.013 |
2020-12-31 | 0.029 | 1 | 0.012 |
2020-09-30 | 0.029 | 1 | 0.011 |
2020-06-30 | 0.030 | 1 | 0.011 |
2020-03-31 | 0.031 | 1 | 0.013 |
FVCB Price Target
For more insight on analysts targets of FVCB, see our FVCB price target page. And for a list of of all stocks sorted by upside potential based on analyst target price, see our Top Price Target page.
Average Price Target | $14.12 | Average Broker Recommendation | 1.25 (Strong Buy) |
FVCBankcorp, Inc. (FVCB) Company Bio
FVCBankcorp, Inc. provides various banking products and services in Fairfax, Virginia. The company was founded in 2015 and is headquartered in Fairfax, Virginia.
Latest FVCB News From Around the Web
Below are the latest news stories about FVCBANKCORP INC that investors may wish to consider to help them evaluate FVCB as an investment opportunity.
Retail investors account for 42% of FVCBankcorp, Inc.'s (NASDAQ:FVCB) ownership, while institutions account for 29%Key Insights The considerable ownership by retail investors in FVCBankcorp indicates that they collectively have a... |
FVCBankcorp (FVCB) Q2 Earnings: How Key Metrics Compare to Wall Street EstimatesWhile the top- and bottom-line numbers for FVCBankcorp (FVCB) give a sense of how the business performed in the quarter ended June 2023, it could be worth looking at how some of its key metrics compare to Wall Street estimates and year-ago values. |
FVCBankcorp (FVCB) Beats Q2 Earnings and Revenue EstimatesFVCBankcorp (FVCB) delivered earnings and revenue surprises of 4.55% and 1.79%, respectively, for the quarter ended June 2023. Do the numbers hold clues to what lies ahead for the stock? |
FVCBankcorp, Inc. Announces Second Quarter 2023 Earnings; Strong Deposit and Liquidity GrowthFAIRFAX, Va., July 25, 2023--FVCBankcorp, Inc. (NASDAQ: FVCB) (the "Company") today reported its financial results for the second quarter of 2023. |
Earnings Preview: Cadence (CADE) Q2 Earnings Expected to DeclineCadence (CADE) doesn't possess the right combination of the two key ingredients for a likely earnings beat in its upcoming report. Get prepared with the key expectations. |
FVCB Price Returns
1-mo | -1.62% |
3-mo | 8.88% |
6-mo | 7.16% |
1-year | -24.61% |
3-year | 49.07% |
5-year | -27.78% |
YTD | -24.49% |
2022 | -3.10% |
2021 | 33.88% |
2020 | -15.86% |
2019 | -0.80% |
2018 | 0.51% |
Continue Researching FVCB
Want to see what other sources are saying about FVCBankcorp Inc's financials and stock price? Try the links below:FVCBankcorp Inc (FVCB) Stock Price | Nasdaq
FVCBankcorp Inc (FVCB) Stock Quote, History and News - Yahoo Finance
FVCBankcorp Inc (FVCB) Stock Price and Basic Information | MarketWatch
Loading social stream, please wait...