Genpact Limited (G): Price and Financial Metrics
G Price/Volume Stats
Current price | $33.12 | 52-week high | $46.25 |
Prev. close | $32.76 | 52-week low | $29.41 |
Day low | $32.73 | Volume | 195,283 |
Day high | $33.20 | Avg. volume | 1,472,341 |
50-day MA | $34.81 | Dividend yield | 1.89% |
200-day MA | $35.62 | Market Cap | 5.97B |
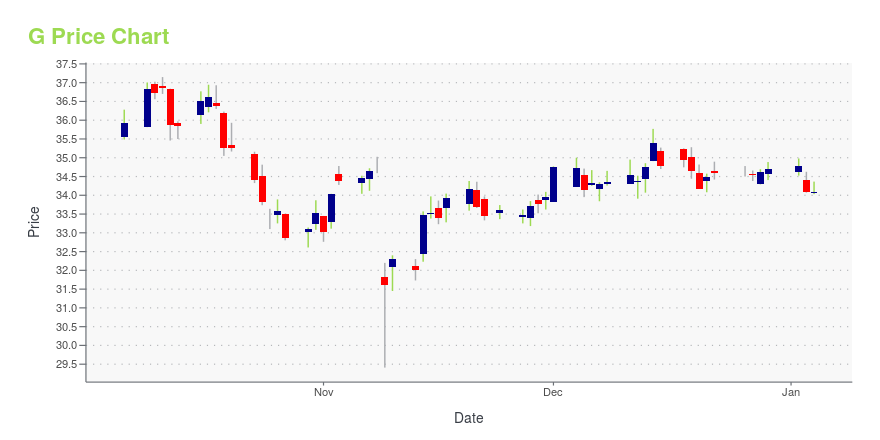
G Stock Price Chart Interactive Chart >
G POWR Grades
- Quality is the dimension where G ranks best; there it ranks ahead of 93.21% of US stocks.
- The strongest trend for G is in Growth, which has been heading down over the past 26 weeks.
- G's current lowest rank is in the Sentiment metric (where it is better than 23.48% of US stocks).
G Stock Summary
- GENPACT LTD's market capitalization of $6,184,348,682 is ahead of 76.86% of US-listed equities.
- Of note is the ratio of GENPACT LTD's sales and general administrative expense to its total operating expenses; 80.61% of US stocks have a lower such ratio.
- GENPACT LTD's shareholder yield -- a measure of how much capital is returned to stockholders via dividends and buybacks -- is 6.73%, greater than the shareholder yield of 76.64% of stocks in our set.
- If you're looking for stocks that are quantitatively similar to GENPACT LTD, a group of peers worth examining would be CMC, CCS, SXI, KMT, and MCFT.
- G's SEC filings can be seen here. And to visit GENPACT LTD's official web site, go to www.genpact.com.
G Valuation Summary
- In comparison to the median Technology stock, G's EV/EBIT ratio is 44.81% lower, now standing at 11.7.
- G's price/sales ratio has moved down 3.4 over the prior 199 months.
Below are key valuation metrics over time for G.
Stock | Date | P/S | P/B | P/E | EV/EBIT |
---|---|---|---|---|---|
G | 2023-12-08 | 1.4 | 3.1 | 14.5 | 11.7 |
G | 2023-12-07 | 1.4 | 3.1 | 14.5 | 11.7 |
G | 2023-12-06 | 1.4 | 3.1 | 14.5 | 11.7 |
G | 2023-12-05 | 1.4 | 3.1 | 14.4 | 11.6 |
G | 2023-12-04 | 1.4 | 3.1 | 14.7 | 11.8 |
G | 2023-12-01 | 1.4 | 3.1 | 14.7 | 11.8 |
G Growth Metrics
- Its 5 year net cashflow from operations growth rate is now at 6.71%.
- The year over year price growth rate now stands at -13.31%.
- The 3 year net income to common stockholders growth rate now stands at 34.58%.
The table below shows G's growth in key financial areas (numbers in millions of US dollars).
Date | Revenue | Operating Cash Flow | Net Income to Common Stock |
---|---|---|---|
2022-09-30 | 4,340.904 | 460.846 | 336.777 |
2022-06-30 | 4,245.604 | 444.568 | 343.32 |
2022-03-31 | 4,144.583 | 502.844 | 374.354 |
2021-12-31 | 4,022.211 | 694.281 | 369.448 |
2021-09-30 | 3,900.502 | 606.572 | 371.345 |
2021-06-30 | 3,820.288 | 649.014 | 354.394 |
G's Quality Factors
The “Quality” component of the POWR Ratings focuses on 31 different factors of a companies fundamentals and operational strength. Here are some key insights as we drill into the specifics of these quality attributes.- G has a Quality Grade of B, ranking ahead of 82.32% of graded US stocks.
- G's asset turnover comes in at 0.789 -- ranking 188th of 563 Business Services stocks.
- LTRPA, EPAY, and III are the stocks whose asset turnover ratios are most correlated with G.
The table below shows G's key quality metrics over time.
Period | Asset Turnover | Gross Margin | ROIC |
---|---|---|---|
2021-06-30 | 0.789 | 0.358 | 0.165 |
2021-03-31 | 0.773 | 0.353 | 0.145 |
2020-12-31 | 0.784 | 0.348 | 0.144 |
2020-09-30 | 0.800 | 0.342 | 0.148 |
2020-06-30 | 0.821 | 0.342 | 0.153 |
2020-03-31 | 0.857 | 0.345 | 0.165 |
G Price Target
For more insight on analysts targets of G, see our G price target page. And for a list of of all stocks sorted by upside potential based on analyst target price, see our Top Price Target page.
Average Price Target | $54.70 | Average Broker Recommendation | 1.45 (Moderate Buy) |
Genpact Limited (G) Company Bio
Genpact Limited provides business process outsourcing and information technology services worldwide, in areas such as banking and financial services, insurance services, capital markets, consumer product goods services, life sciences and pharmaceutical services, infrastructure and manufacturing services, healthcare and high tech services. The company was founded in 1997 and is based in Hamilton, Bermuda.
Latest G News From Around the Web
Below are the latest news stories about GENPACT LTD that investors may wish to consider to help them evaluate G as an investment opportunity.
Genpact Limited's (NYSE:G) Price In Tune With EarningsIt's not a stretch to say that Genpact Limited's ( NYSE:G ) price-to-earnings (or "P/E") ratio of 14.7x right now seems... |
Strategic Collaborations Aid Genpact (G) Amid Rising CostsGenpact (G) is growing through its strategic collaborations and shareholder-friendly initiatives, while seasonality and rising costs are worrisome. |
Insider Sell Alert: Senior Vice President Kathryn Stein Sells Over 57,000 Shares of Genpact LtdIn a notable insider transaction, Senior Vice President Kathryn Stein has sold 57,336 shares of Genpact Ltd (NYSE:G), a global professional services firm delivering digital transformation for its clients. |
Rightpoint, a Genpact Company, Earns Epic Games’ Prestigious Unreal Engine Service Partner StatusCHICAGO, December 07, 2023--Rightpoint, a global experience leader and Genpact (NYSE: G) company, announced today it has been accepted to Epic’s Unreal Engine Service Partner Program. Created by Epic Games, Unreal Engine is the world's most open and advanced real-time 3D creation tool for photoreal visuals and immersive experiences. Rightpoint’s partner status is a recognition of proven expertise in delivering exceptional solutions to clients that are powered by VR and AR and underpinned by its |
Genpact Strengthens Executive Team with Leadership Appointments for Investor Relations and MarketingGenpact (NYSE: G), a global professional services firm focused on delivering outcomes that transform businesses, announced the following appointments to its executive team: |
G Price Returns
1-mo | -6.47% |
3-mo | -4.16% |
6-mo | -7.73% |
1-year | -25.96% |
3-year | -22.37% |
5-year | -0.45% |
YTD | -4.16% |
2023 | -23.98% |
2022 | -11.74% |
2021 | 29.52% |
2020 | -0.93% |
2019 | 57.66% |
G Dividends
Ex-Dividend Date | Type | Payout Amount | Change | ||||||
---|---|---|---|---|---|---|---|---|---|
Loading, please wait... |
Continue Researching G
Want to see what other sources are saying about Genpact LTD's financials and stock price? Try the links below:Genpact LTD (G) Stock Price | Nasdaq
Genpact LTD (G) Stock Quote, History and News - Yahoo Finance
Genpact LTD (G) Stock Price and Basic Information | MarketWatch
Loading social stream, please wait...