Genpact Limited (G): Price and Financial Metrics

Genpact Limited (G): $36.37

0.72 (-1.94%)

POWR Rating

Component Grades

Momentum

D

Stability

C

Sentiment

Quality

B

G Price/Volume Stats
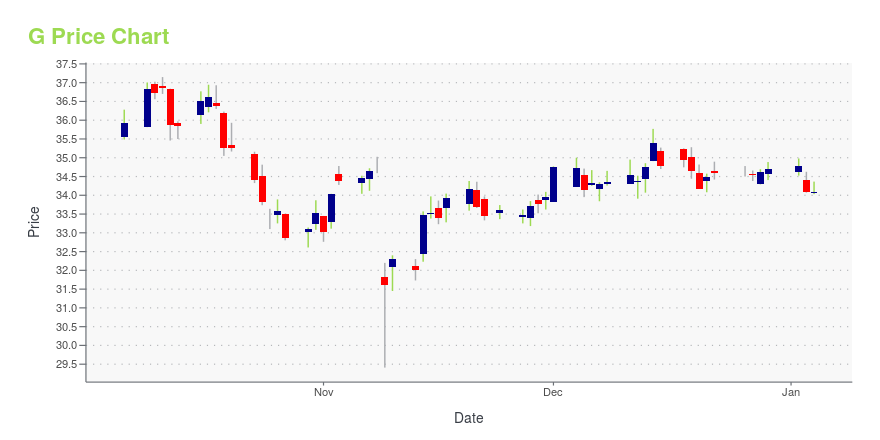
Current price $36.37 52-week high $48.85
Prev. close $37.09 52-week low $35.31
Day low $36.35 Volume 795,400
Day high $37.00 Avg. volume 1,138,000
50-day MA $36.97 Dividend yield 1.5%
200-day MA $41.73 Market Cap 6.59B

G Stock Price Chart Interactive Chart >

G POWR Grades

  • G scores best on the Quality dimension, with a Quality rank ahead of 94.07% of US stocks.
  • The strongest trend for G is in Stability, which has been heading down over the past 177 days.
  • G's current lowest rank is in the Momentum metric (where it is better than 24.73% of US stocks).

G Stock Summary

  • GENPACT LTD's market capitalization of $6,641,682,150 is ahead of 79.84% of US-listed equities.
  • Of note is the ratio of GENPACT LTD's sales and general administrative expense to its total operating expenses; 77.33% of US stocks have a lower such ratio.
  • With a year-over-year growth in debt of -12.13%, GENPACT LTD's debt growth rate surpasses just 22.75% of about US stocks.
  • Stocks with similar financial metrics, market capitalization, and price volatility to GENPACT LTD are PETS, EDR, CMC, SND, and BIRD.
  • Visit G's SEC page to see the company's official filings. To visit the company's web site, go to www.genpact.com.

G Valuation Summary

  • In comparison to the median Technology stock, G's price/sales ratio is 42.31% lower, now standing at 1.5.
  • Over the past 196 months, G's price/sales ratio has gone down 3.3.

Below are key valuation metrics over time for G.

Stock Date P/S P/B P/E EV/EBIT
G 2023-09-22 1.5 3.4 16.3 13.2
G 2023-09-21 1.5 3.4 16.3 13.3
G 2023-09-20 1.5 3.5 16.5 13.4
G 2023-09-19 1.5 3.5 16.4 13.3
G 2023-09-18 1.5 3.5 16.4 13.3
G 2023-09-15 1.5 3.5 16.4 13.4

G Growth Metrics

    Its 5 year net cashflow from operations growth rate is now at 6.71%.
  • The year over year price growth rate now stands at -13.31%.
  • The 3 year net income to common stockholders growth rate now stands at 34.58%.
Over the past 67 months, G's revenue has gone up $1,756,856,000.

The table below shows G's growth in key financial areas (numbers in millions of US dollars).

Date Revenue Operating Cash Flow Net Income to Common Stock
2022-09-30 4,340.904 460.846 336.777
2022-06-30 4,245.604 444.568 343.32
2022-03-31 4,144.583 502.844 374.354
2021-12-31 4,022.211 694.281 369.448
2021-09-30 3,900.502 606.572 371.345
2021-06-30 3,820.288 649.014 354.394

G's Quality Factors

The “Quality” component of the POWR Ratings focuses on 31 different factors of a companies fundamentals and operational strength. Here are some key insights as we drill into the specifics of these quality attributes.
  • G has a Quality Grade of B, ranking ahead of 82.32% of graded US stocks.
  • G's asset turnover comes in at 0.789 -- ranking 188th of 563 Business Services stocks.
  • LTRPA, EPAY, and III are the stocks whose asset turnover ratios are most correlated with G.

The table below shows G's key quality metrics over time.

Period Asset Turnover Gross Margin ROIC
2021-06-30 0.789 0.358 0.165
2021-03-31 0.773 0.353 0.145
2020-12-31 0.784 0.348 0.144
2020-09-30 0.800 0.342 0.148
2020-06-30 0.821 0.342 0.153
2020-03-31 0.857 0.345 0.165

G Price Target

For more insight on analysts targets of G, see our G price target page. And for a list of of all stocks sorted by upside potential based on analyst target price, see our Top Price Target page.

Average Price Target $54.70 Average Broker Recommendation 1.45 (Moderate Buy)

Genpact Limited (G) Company Bio


Genpact Limited provides business process outsourcing and information technology services worldwide, in areas such as banking and financial services, insurance services, capital markets, consumer product goods services, life sciences and pharmaceutical services, infrastructure and manufacturing services, healthcare and high tech services. The company was founded in 1997 and is based in Hamilton, Bermuda.


G Latest News Stream


Event/Time News Detail
Loading, please wait...

G Latest Social Stream


Loading social stream, please wait...

View Full G Social Stream

Latest G News From Around the Web

Below are the latest news stories about GENPACT LTD that investors may wish to consider to help them evaluate G as an investment opportunity.

Reasons Why You Should Retain Genpact (G) in Your Portfolio

Genpact (G) gains from its strong hold of the BPO market and shareholder-friendly policies. Rising talent cost pressurizes the bottom line.

Yahoo | September 7, 2023

Genpact Named a Top Data Science Service Provider for 2023 by Analytics India Magazine (AIM) Research

Genpact (NYSE: G), a global professional services firm focused on delivering outcomes that transform businesses, today announced its recognition as one of the "Top Data Science Service Providers 2023" by Analytics India Magazine (AIM) Research, a market research firm that specializes in leveraging the power of AI and data science to deliver powerful insights into today's markets.

Yahoo | September 7, 2023

Zacks Industry Outlook Highlights Automatic Data Processing, Paychex, Broadridge Financial Solutions and Genpact

Automatic Data Processing, Paychex, Broadridge Financial Solutions and Genpact are part of the Zacks Industry Outlook article.

Yahoo | September 6, 2023

4 Stocks to Benefit from a Blooming Outsourcing Industry

The Zacks Outsourcing industry is expected to prosper with the rising importance of business and IT outsourcing. ADP, PAYX, BR and G are well poised to gain from the prevailing trends.

Yahoo | September 5, 2023

Warren Buffett's top holdings in 2001 vs. 2023: Chart of the Day

Yahoo Finance Live anchor Rachelle Akuffo compares Berkshire Hathaway's (BRK-A, BRK-B) top holdings from 2001 to its current holdings in 2023, as Founder Warren Buffett shifted his interests from stocks like Coca-Cola (KO) and American Express (AXP) to the iPhone maker Apple (AAPL).

Yahoo | August 31, 2023

Read More 'G' Stories Here

G Price Returns

1-mo -0.34%
3-mo -0.83%
6-mo -19.51%
1-year -15.28%
3-year -1.41%
5-year 25.23%
YTD -20.66%
2022 -11.74%
2021 29.52%
2020 -0.93%
2019 57.66%
2018 -14.12%

G Dividends

Ex-Dividend Date Type Payout Amount Change
Loading, please wait...
View Full G Dividend History

Continue Researching G

Want to see what other sources are saying about Genpact LTD's financials and stock price? Try the links below:

Genpact LTD (G) Stock Price | Nasdaq
Genpact LTD (G) Stock Quote, History and News - Yahoo Finance
Genpact LTD (G) Stock Price and Basic Information | MarketWatch

Get Free Updates

Join thousands of investors who get the latest news, insights and top rated picks from StockNews.com!