Gaia, Inc. - (GAIA): Price and Financial Metrics
GET POWR RATINGS... FREE!
GAIA POWR Grades
- GAIA scores best on the Sentiment dimension, with a Sentiment rank ahead of 95.55% of US stocks.
- The strongest trend for GAIA is in Growth, which has been heading up over the past 130 days.
- GAIA ranks lowest in Momentum; there it ranks in the 27th percentile.
GAIA Stock Summary
- GAIA has a market capitalization of $110,035,967 -- more than approximately only 15.95% of US stocks.
- Of note is the ratio of Gaia Inc's sales and general administrative expense to its total operating expenses; 83.91% of US stocks have a lower such ratio.
- Over the past twelve months, GAIA has reported earnings growth of 146.07%, putting it ahead of 86.32% of US stocks in our set.
- If you're looking for stocks that are quantitatively similar to Gaia Inc, a group of peers worth examining would be LAWS, MIXT, HGBL, HZO, and ZUMZ.
- GAIA's SEC filings can be seen here. And to visit Gaia Inc's official web site, go to www.gaia.com.
GAIA Valuation Summary
- GAIA's EV/EBIT ratio is 23.8; this is 26.2% lower than that of the median Technology stock.
- GAIA's price/earnings ratio has moved down 52.4 over the prior 243 months.
- GAIA's price/sales ratio has moved down 0.7 over the prior 243 months.
Below are key valuation metrics over time for GAIA.
Stock | Date | P/S | P/B | P/E | EV/EBIT |
---|---|---|---|---|---|
GAIA | 2021-09-01 | 2.5 | 2.4 | 24.5 | 23.8 |
GAIA | 2021-08-31 | 2.5 | 2.5 | 24.7 | 24.0 |
GAIA | 2021-08-30 | 2.6 | 2.5 | 24.9 | 24.2 |
GAIA | 2021-08-27 | 2.5 | 2.5 | 24.8 | 24.1 |
GAIA | 2021-08-26 | 2.6 | 2.5 | 25.6 | 24.8 |
GAIA | 2021-08-25 | 2.7 | 2.6 | 26.3 | 25.6 |
GAIA Growth Metrics
- Its 4 year price growth rate is now at 51.42%.
- The 2 year net cashflow from operations growth rate now stands at 112.42%.
- The 5 year net income to common stockholders growth rate now stands at 2.81%.

The table below shows GAIA's growth in key financial areas (numbers in millions of US dollars).
Date | Revenue | Operating Cash Flow | Net Income to Common Stock |
---|---|---|---|
2021-12-31 | 79.573 | 20.867 | 3.731 |
2021-09-30 | 77.37 | 19.039 | 1.958 |
2021-06-30 | 74.502 | 17.226 | 7.625 |
2021-03-31 | 71.212 | 14.832 | 4.457 |
2020-12-31 | 66.827 | 11.65 | 0.519 |
2020-09-30 | 62.889 | 10.543 | -2.603 |
GAIA's Quality Factors
The “Quality” component of the POWR Ratings focuses on 31 different factors of a companies fundamentals and operational strength. Here are some key insights as we drill into the specifics of these quality attributes.- GAIA has a Quality Grade of B, ranking ahead of 78.17% of graded US stocks.
- GAIA's asset turnover comes in at 0.673 -- ranking 9th of 44 Entertainment stocks.
- RDI, AMC, and DIS are the stocks whose asset turnover ratios are most correlated with GAIA.
The table below shows GAIA's key quality metrics over time.
Period | Asset Turnover | Gross Margin | ROIC |
---|---|---|---|
2021-06-30 | 0.673 | 0.871 | 0.108 |
2021-03-31 | 0.658 | 0.871 | 0.067 |
2020-12-31 | 0.628 | 0.871 | 0.010 |
2020-09-30 | 0.596 | 0.870 | -0.030 |
2020-06-30 | 0.560 | 0.869 | -0.167 |
2020-03-31 | 0.525 | 0.868 | -0.195 |
GAIA Price Target
For more insight on analysts targets of GAIA, see our GAIA price target page. And for a list of of all stocks sorted by upside potential based on analyst target price, see our Top Price Target page.
Average Price Target | $17.50 | Average Broker Recommendation | 1.33 (Strong Buy) |
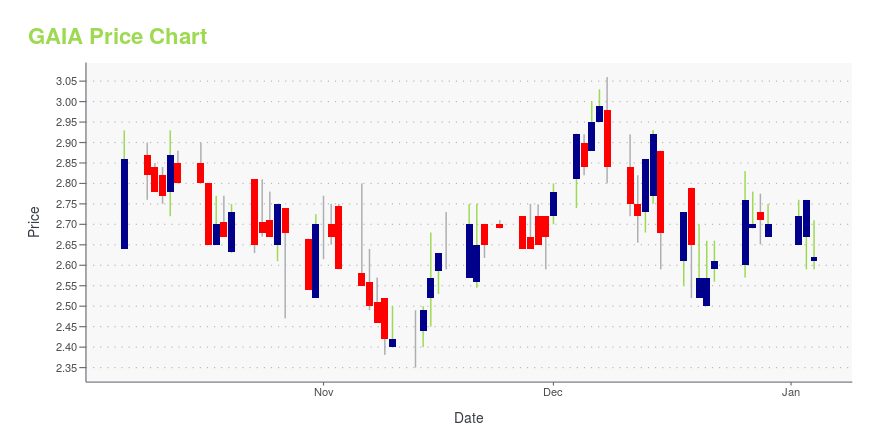
GAIA Stock Price Chart Interactive Chart >
GAIA Price/Volume Stats
Current price | $4.19 | 52-week high | $12.42 |
Prev. close | $4.25 | 52-week low | $4.00 |
Day low | $4.18 | Volume | 4,833 |
Day high | $4.43 | Avg. volume | 53,392 |
50-day MA | $4.78 | Dividend yield | N/A |
200-day MA | $7.16 | Market Cap | 87.05M |
Gaia, Inc. - (GAIA) Company Bio
Gaiam, Inc. provides a range of yoga, fitness, and well-being products worldwide. It operates in two segments, Gaiam Brand and Gaiam TV. The company develops and markets yoga and fitness accessories, including yoga mats, bags, straps, and blocks; restorative and massage accessories, such as rollers, resistance cords, balance balls, and various other offerings; apparel comprising pants, shorts, tops, and jackets designed around yoga; and media content consisting of digital media and apps under the Gaiam, Gaiam Restore, and SPRI brands. The company was founded in 1988 and is based in Louisville, Colorado.
Latest GAIA News From Around the Web
Below are the latest news stories about Gaia Inc that investors may wish to consider to help them evaluate GAIA as an investment opportunity.
FuboTV Inc. (FUBO) Reports Q4 Loss, Tops Revenue EstimatesfuboTV Inc. (FUBO) delivered earnings and revenue surprises of -15.15% and 8.22%, respectively, for the quarter ended December 2021. Do the numbers hold clues to what lies ahead for the stock? |
Gaiam (GAIA) Reports Next Week: Wall Street Expects Earnings GrowthGaiam (GAIA) doesn't possess the right combination of the two key ingredients for a likely earnings beat in its upcoming report. Get prepared with the key expectations. |
Roku (ROKU) Q4 Earnings Beat EstimatesRoku (ROKU) delivered earnings and revenue surprises of 183.33% and 3.17%, respectively, for the quarter ended December 2021. Do the numbers hold clues to what lies ahead for the stock? |
Gaia Sets Fourth Quarter and Full Year 2021 Conference Call for Monday, February 28, 2022, at 4:30 p.m. ETBOULDER, Colo., Feb. 15, 2022 (GLOBE NEWSWIRE) -- Gaia, Inc. (NASDAQ: GAIA) (“Gaia”), a subscription video-streaming service dedicated to conscious media and serving a global conscious community, will conduct a conference call on Monday, February 28, 2022, at 4:30 p.m. Eastern time (2:30 p.m. Mountain time) to discuss its financial results for the fourth quarter and full year ended December 31, 2021. The company will report its financial results in a press release prior to the call. Gaia managem |
Declining Stock and Decent Financials: Is The Market Wrong About Gaia, Inc. (NASDAQ:GAIA)?It is hard to get excited after looking at Gaia's (NASDAQ:GAIA) recent performance, when its stock has declined 29... |
GAIA Price Returns
1-mo | -13.07% |
3-mo | -21.83% |
6-mo | -51.11% |
1-year | -62.01% |
3-year | -44.36% |
5-year | -62.59% |
YTD | -51.11% |
2021 | -13.26% |
2020 | 23.65% |
2019 | -22.88% |
2018 | -16.45% |
2017 | 43.35% |
Continue Researching GAIA
Here are a few links from around the web to help you further your research on Gaia Inc's stock as an investment opportunity:Gaia Inc (GAIA) Stock Price | Nasdaq
Gaia Inc (GAIA) Stock Quote, History and News - Yahoo Finance
Gaia Inc (GAIA) Stock Price and Basic Information | MarketWatch
Loading social stream, please wait...