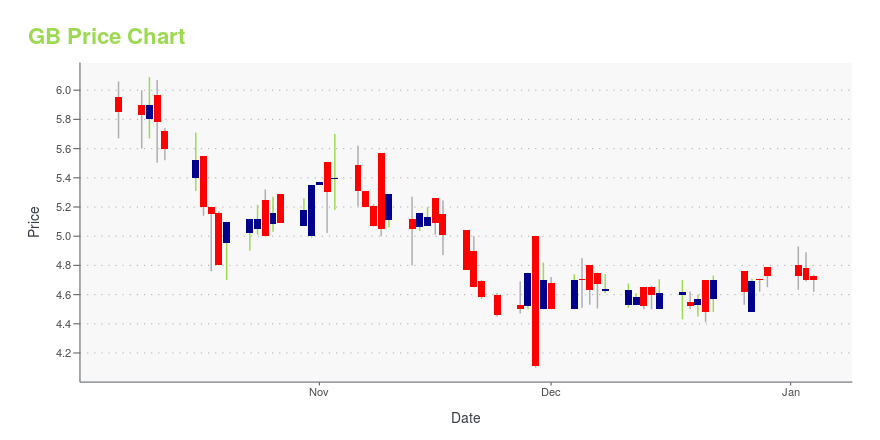
Global Blue Group Holding AG (GB): Price and Financial Metrics
GB Price/Volume Stats
| Current price | $7.46 | 52-week high | $8.00 |
| Prev. close | $7.48 | 52-week low | $4.29 |
| Day low | $7.46 | Volume | 45,300 |
| Day high | $7.49 | Avg. volume | 452,663 |
| 50-day MA | $7.41 | Dividend yield | N/A |
| 200-day MA | $6.57 | Market Cap | 1.49B |
GB Stock Price Chart Interactive Chart >
Global Blue Group Holding AG (GB) Company Bio
Global Blue Group Holding AG provides strategic technology and payments partner services to merchants worldwide. The company operates through two segments, Tax Free Shopping Technology Solutions (TFSS) and Added-Value Payment Solutions (AVPS). It operates a technology platform that serves a network of approximately 400,000 merchant stores. The company offers merchants a range of in-store issuing software solutions to their needs, as well as pre- and post-transaction services to attract and serve international shoppers; and AVPS, including point-of-sale dynamic currency conversion (DCC) services for the retail and hospitality sectors, as well as e-commerce dynamic currency conversion solutions, services, and software for automated teller machines and multi-currency processing for online merchants. It also provides services to international shoppers to reclaim VAT on eligible goods purchased outside their country of origin; and pay for goods and services abroad in their home currency through DCC services. The company was incorporated in 2019 and is based in Brüttisellen, Switzerland. Global Blue Group Holding AG is a subsidiary of SL Globetrotter, L.P.
GB Price Returns
| 1-mo | 0.27% |
| 3-mo | 1.77% |
| 6-mo | 22.70% |
| 1-year | 55.74% |
| 3-year | 48.90% |
| 5-year | N/A |
| YTD | 7.65% |
| 2024 | 46.51% |
| 2023 | 2.16% |
| 2022 | -27.60% |
| 2021 | -50.81% |
| 2020 | N/A |


Loading social stream, please wait...