Greenbrier Companies, Inc. (The) (GBX): Price and Financial Metrics

Greenbrier Companies, Inc. (The) (GBX): $39.50

0.35 (-0.88%)

POWR Rating

Component Grades

Momentum

C

Stability

D

Sentiment

Quality

D

Add GBX to Watchlist
Sign Up

Industry: Railroads

Industry

B

Ranked

#11 of 15

in industry

GBX Price/Volume Stats

Current price $39.50 52-week high $48.21
Prev. close $39.85 52-week low $23.80
Day low $39.21 Volume 179,800
Day high $40.16 Avg. volume 343,283
50-day MA $42.59 Dividend yield 2.91%
200-day MA $34.34 Market Cap 1.22B

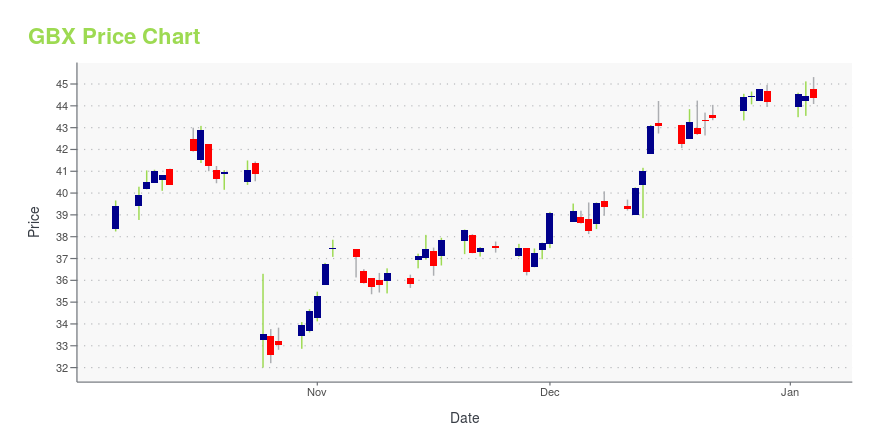
GBX Stock Price Chart Interactive Chart >

GBX POWR Grades

  • Growth is the dimension where GBX ranks best; there it ranks ahead of 88.48% of US stocks.
  • The strongest trend for GBX is in Momentum, which has been heading up over the past 177 days.
  • GBX's current lowest rank is in the Stability metric (where it is better than 13.17% of US stocks).

GBX Stock Summary

  • The ratio of debt to operating expenses for GREENBRIER COMPANIES INC is higher than it is for about 84.98% of US stocks.
  • GBX's price/sales ratio is 0.33; that's higher than the P/S ratio of merely 11.49% of US stocks.
  • As for revenue growth, note that GBX's revenue has grown 47.64% over the past 12 months; that beats the revenue growth of 88.54% of US companies in our set.
  • Stocks with similar financial metrics, market capitalization, and price volatility to GREENBRIER COMPANIES INC are WSC, PMTS, ADNT, OLN, and USAP.
  • Visit GBX's SEC page to see the company's official filings. To visit the company's web site, go to www.gbrx.com.

GBX Valuation Summary

  • In comparison to the median Industrials stock, GBX's price/sales ratio is 75% lower, now standing at 0.3.
  • Over the past 243 months, GBX's price/sales ratio has gone down 0.3.

Below are key valuation metrics over time for GBX.

Stock Date P/S P/B P/E EV/EBIT
GBX 2023-09-19 0.3 1 21.1 14.9
GBX 2023-09-18 0.3 1 20.9 14.8
GBX 2023-09-15 0.3 1 20.9 14.8
GBX 2023-09-14 0.3 1 21.3 14.9
GBX 2023-09-13 0.3 1 20.7 14.7
GBX 2023-09-12 0.3 1 21.0 14.8

GBX Growth Metrics

    The 4 year net cashflow from operations growth rate now stands at -102.95%.
  • Its 2 year cash and equivalents growth rate is now at 237.6%.
  • The 2 year net income to common stockholders growth rate now stands at 4.83%.
Over the past 52 months, GBX's revenue has gone up $674,036,000.

The table below shows GBX's growth in key financial areas (numbers in millions of US dollars).

Date Revenue Operating Cash Flow Net Income to Common Stock
2022-12-31 3,193.5 -209.2 19.4
2022-09-30 2,977.7 -150.4 46.9
2022-06-30 2,626.227 -245.087 58.477
2022-03-31 2,282.87 -166.051 75.114
2021-12-31 1,895.692 -245.896 53.249
2021-09-30 1,747.981 -40.525 32.477

GBX's Quality Factors

The “Quality” component of the POWR Ratings focuses on 31 different factors of a companies fundamentals and operational strength. Here are some key insights as we drill into the specifics of these quality attributes.
  • GBX has a Quality Grade of C, ranking ahead of 31.36% of graded US stocks.
  • GBX's asset turnover comes in at 0.55 -- ranking 8th of 10 Shipbuilding Railroad Equipment stocks.
  • TRN, GD, and RAIL are the stocks whose asset turnover ratios are most correlated with GBX.

The table below shows GBX's key quality metrics over time.

Period Asset Turnover Gross Margin ROIC
2021-08-31 0.550 0.132 0.011
2021-05-31 0.572 0.112 0.003
2021-02-28 0.668 0.111 0.014
2020-11-30 0.780 0.124 0.031
2020-08-31 0.904 0.126 0.040
2020-05-31 1.009 0.137 0.054

GBX Price Target

For more insight on analysts targets of GBX, see our GBX price target page. And for a list of of all stocks sorted by upside potential based on analyst target price, see our Top Price Target page.

Average Price Target $52.20 Average Broker Recommendation 1.58 (Moderate Buy)

Greenbrier Companies, Inc. (The) (GBX) Company Bio


The Greenbrier Companies designs, manufactures, and markets railroad freight car equipment in North America and Europe. The company was founded in 1974 and is based in Lake Oswego, Oregon.


GBX Latest News Stream


Event/Time News Detail
Loading, please wait...

GBX Latest Social Stream


Loading social stream, please wait...

View Full GBX Social Stream

Latest GBX News From Around the Web

Below are the latest news stories about GREENBRIER COMPANIES INC that investors may wish to consider to help them evaluate GBX as an investment opportunity.

Air Canada (ACDVF) to Modernize Fleet Through Boeing Order

Air Canada (ACDVF) decides to convert the previously announced order for freighters to 787-10 Dreamliners.

Yahoo | September 26, 2023

Greenbrier Companies (GBX) Stock Sinks As Market Gains: What You Should Know

Greenbrier Companies (GBX) closed at $40.59 in the latest trading session, marking a -0.54% move from the prior day.

Yahoo | September 25, 2023

Greenbrier nets most rail car orders ‘in nearly a decade’

Although U.S. rail volumes may still be sluggish, Greenbrier received orders for 15,300 new rail cars in its latest fiscal quarter. The orders have an aggregate value of $1.9 billion. The post Greenbrier nets most rail car orders ‘in nearly a decade’ appeared first on FreightWaves.

Yahoo | September 21, 2023

Greenbrier (GBX): A Closer Look at Its Modestly Undervalued Market Position

Understanding Greenbrier's True Worth: A Comprehensive Analysis of Its Market Value

Yahoo | September 21, 2023

Greenbrier announces orders for 15,300 new railcars valued at $1.9 billion

The Greenbrier Companies, Inc. (NYSE: GBX) today announced that it had received orders for 15,300 new railcars with an aggregate value of $1.9 billion during its fiscal fourth quarter ended on August 31, 2023. Orders for the quarter demonstrate Greenbrier's lease origination capabilities balanced with its direct sale expertise. The 15,300 units were ordered by customers operating in various commercial sectors and spanned a range of railcar types, yielding Greenbrier's highest quarterly order cou

Yahoo | September 21, 2023

Read More 'GBX' Stories Here

GBX Price Returns

1-mo N/A
3-mo -6.70%
6-mo N/A
1-year 54.95%
3-year 37.90%
5-year -24.83%
YTD 20.89%
2022 -24.80%
2021 29.44%
2020 17.62%
2019 -15.52%
2018 -24.34%

GBX Dividends

Ex-Dividend Date Type Payout Amount Change
Loading, please wait...
View Full GBX Dividend History

Continue Researching GBX

Want to see what other sources are saying about Greenbrier Companies Inc's financials and stock price? Try the links below:

Greenbrier Companies Inc (GBX) Stock Price | Nasdaq
Greenbrier Companies Inc (GBX) Stock Quote, History and News - Yahoo Finance
Greenbrier Companies Inc (GBX) Stock Price and Basic Information | MarketWatch

Get Free Updates

Join thousands of investors who get the latest news, insights and top rated picks from StockNews.com!