
GD Culture Group Ltd. (GDC): Price and Financial Metrics
GDC Price/Volume Stats
| Current price | $2.40 | 52-week high | $12.18 |
| Prev. close | $2.60 | 52-week low | $1.03 |
| Day low | $2.37 | Volume | 18,000 |
| Day high | $2.59 | Avg. volume | 309,877 |
| 50-day MA | $2.42 | Dividend yield | N/A |
| 200-day MA | $2.49 | Market Cap | 40.31M |
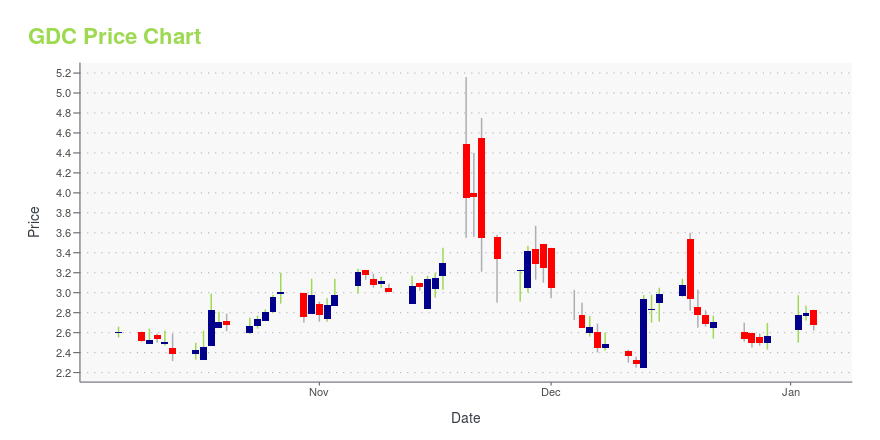
GDC Stock Price Chart Interactive Chart >
GDC Price Returns
| 1-mo | 5.26% |
| 3-mo | 18.81% |
| 6-mo | 26.32% |
| 1-year | 105.13% |
| 3-year | -86.32% |
| 5-year | -96.12% |
| YTD | 26.98% |
| 2024 | -26.46% |
| 2023 | 23.04% |
| 2022 | -93.49% |
| 2021 | -44.85% |
| 2020 | 61.67% |
Loading social stream, please wait...