
GD Culture Group Ltd. (GDC): Price and Financial Metrics
GDC Price/Volume Stats
| Current price | $1.23 | 52-week high | $5.34 |
| Prev. close | $1.16 | 52-week low | $0.59 |
| Day low | $1.14 | Volume | 28,050 |
| Day high | $1.26 | Avg. volume | 146,239 |
| 50-day MA | $1.14 | Dividend yield | N/A |
| 200-day MA | $1.83 | Market Cap | 11.69M |
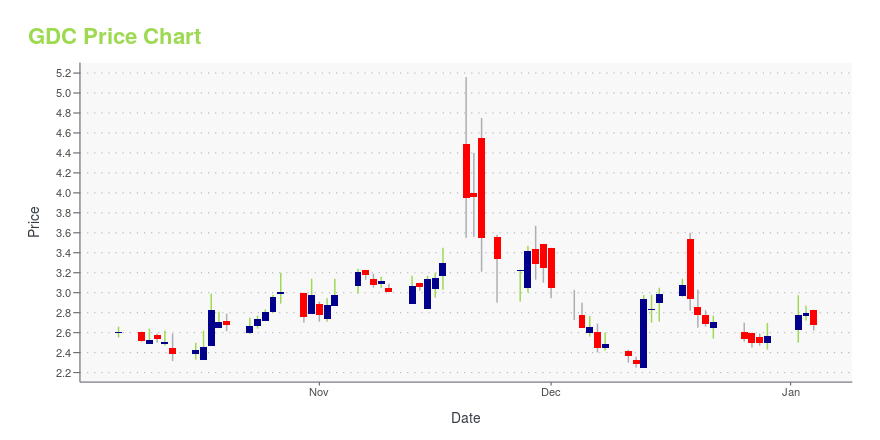
GDC Stock Price Chart Interactive Chart >
Latest GDC News From Around the Web
Below are the latest news stories about GD CULTURE GROUP LTD that investors may wish to consider to help them evaluate GDC as an investment opportunity.
GD Culture Group Unveils its Innovative Marketing Approach, One Story at a TimeA Strategic Evolution in the Next Phase of Influencer Marketing: From Virtual Spokesperson to Dynamic Storyteller NEW YORK, Dec. 19, 2023 (GLOBE NEWSWIRE) -- GD Culture Group Limited (“GDC” or the “Company”) (Nasdaq: GDC), a Nevada holding company currently conducting business through its subsidiary, AI Catalysis Corp. (“AI Catalysis”), today unveiled its innovative marketing approach, named One Story at a Time, with a primary focus on enhancing audience experiences on TikTok. The One Story at a |
GD Culture Group’s Portfolio Company DigiTrax Unveils New AI Music Training Model License for Publishers, Composers, Producers, and BeatmakersNEW YORK, Dec. 01, 2023 (GLOBE NEWSWIRE) -- GD Culture Group Limited (“GDC” or the “Company”) (Nasdaq: GDC), a Nevada holding company conducting business through its subsidiary AI Catalysis Corp. (“AI Catalysis”), today announced that its portfolio company, DigiTrax Entertainment, Inc., (“DigiTrax”), a music company at the forefront of transforming the music industry by pioneering the use of artificial intelligence (AI) solutions, unveiled new AI Music Training Model License offered in its paten |
From Digital Avatars to AI Agents: GD Culture Group to Expand Its AI Frontier with GPT-4-Powered AI AgentNEW YORK, Nov. 29, 2023 (GLOBE NEWSWIRE) -- GD Culture Group Limited (“GDC” or the “Company”) (Nasdaq: GDC), a Nevada holding company currently conducting business through its subsidiary, AI Catalysis Corp. (“AI Catalysis”), today announced its pioneering plan to enhance its digital avatar offerings with OpenAI's GPT-4, transforming them into advanced AI agents capable of goal-oriented tasks and interactive communication. By harnessing the power of OpenAI GPT-4, the AI agents will provide users |
GD Culture Group’s Portfolio Company DigiTrax Releases its Patented AI Music Production Tool KR38R PRONEW YORK, Nov. 22, 2023 (GLOBE NEWSWIRE) -- GD Culture Group Limited (“GDC” or the “Company”) (Nasdaq: GDC), a Nevada holding company conducting business through its subsidiaries AI Catalysis Corp. (“AI Catalysis”), today announced that its portfolio company, DigiTrax Entertainment, Inc., (“DigiTrax”), a music company at the forefront of transforming the music industry by pioneering the use of artificial intelligence (AI) solutions, has released its first AI music production software plugin tool |
GD Culture Group Enters into Memorandum of Understanding with Pier E Media for Expansion into TikTok Agency BusinessNEW YORK, Nov. 21, 2023 (GLOBE NEWSWIRE) -- GD Culture Group Limited (“GDC” or the “Company”) (Nasdaq: GDC), a Nevada holding company conducting business through its subsidiaries AI Catalysis Corp. (“AI Catalysis”), today announced the signing of a Memorandum of Understanding (the “MOU”) between AI Catalysis and Pier E Media, a leading influencer agency that connects brands with influential content creators, to expand its agency business on TikTok. The collaboration marks GDC's strategic expansi |
GDC Price Returns
| 1-mo | 3.36% |
| 3-mo | 73.14% |
| 6-mo | -36.92% |
| 1-year | -60.45% |
| 3-year | -97.63% |
| 5-year | -97.03% |
| YTD | -52.14% |
| 2023 | 23.04% |
| 2022 | -93.49% |
| 2021 | -44.85% |
| 2020 | 61.67% |
| 2019 | N/A |
Loading social stream, please wait...