
Green Dot Corp. (GDOT): Price and Financial Metrics
GDOT Price/Volume Stats
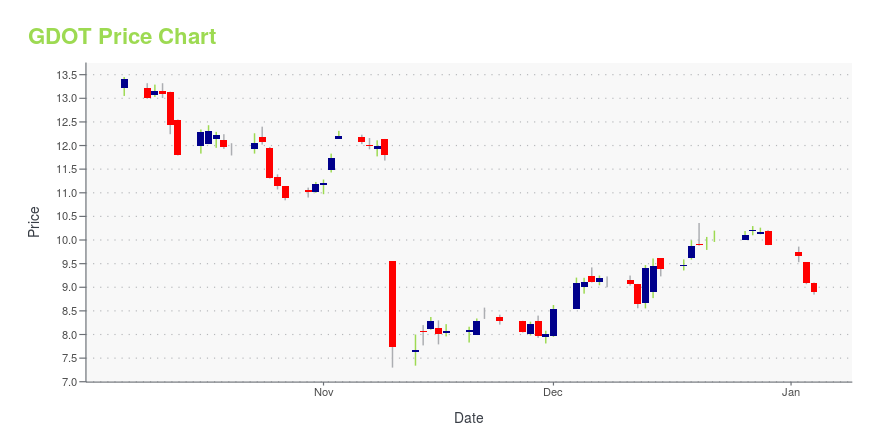
| Current price | $9.60 | 52-week high | $20.08 |
| Prev. close | $9.55 | 52-week low | $7.30 |
| Day low | $9.53 | Volume | 315,791 |
| Day high | $9.75 | Avg. volume | 610,770 |
| 50-day MA | $9.66 | Dividend yield | N/A |
| 200-day MA | $9.41 | Market Cap | 510.82M |
GDOT Stock Price Chart Interactive Chart >
Green Dot Corp. (GDOT) Company Bio
Green Dot Corp. operates as a financial technology leader and bank holding company, which engages in the provision of prepaid cards, debit cards, checking accounts, secured credit cards, payroll debit cards, consumer cash processing services, wage disbursements, and tax refund processing services. It operates through the following segments: Account Services; and Processing and Settlement Services. The Account Services segment offers deposit account programs that can be acquired through omni-channel distribution platform. The Processing and Settlement Services segment comprises of products and services that specialize in facilitating the movement of funds on behalf of consumers and businesses. The company was founded by Steven W. Streit in October 1, 1999 and is headquartered in Pasadena, CA.
Latest GDOT News From Around the Web
Below are the latest news stories about GREEN DOT CORP that investors may wish to consider to help them evaluate GDOT as an investment opportunity.
Green Dot (GDOT) Rises 17% in a Month: Here's What to KnowGreen Dot (GDOT) focuses on the acquisition of long-term users of its products, improving brands and image. |
REPAY Partners with Green Dot to Expand Cash Bill Pay Innovations for Consumers and BusinessesAUSTIN, Texas, December 14, 2023--The Green Dot Network will enable bill payment options for REPAY’s clients and their customers who transact in cash |
Stanley Black & Decker slashed at JPMorgan on slowing earnings: 4 big analyst cutsHere is your Pro Recap of the biggest analyst cuts you may have missed since yesterday: downgrades at Stanley Black & Decker, Green Dot, Deckers Outdoor, and EOG Resources. JPMorgan downgraded Stanley Black & Decker (NYSE:SWK) to Underweight from Neutral with a price target of $89.00. JPMorgan’s decision reflects a cautious stance on the company's earnings growth over the next two years, which it expects to be lower than both Street and buy-side expectations. |
Green Dot Appoints Dave Harden as Chief Technology OfficerAUSTIN, Texas, November 16, 2023--Green Dot Corporation (NYSE: GDOT) today announced the appointment of Dave Harden as Chief Technology Officer supporting the company’s ongoing effort to become a more streamlined, efficient and powerful technology company focused on building and delivering seamless and scalable banking and payment tools for consumers and businesses. |
Green Dot (GDOT) Stock Plunges 34% Since Q3 Earnings MissGreen Dot (GDOT) third-quarter 2023 earnings plunge 68.2% while revenue inch up 1.4% year over year. |
GDOT Price Returns
| 1-mo | -1.13% |
| 3-mo | 6.19% |
| 6-mo | 2.24% |
| 1-year | -49.95% |
| 3-year | -79.20% |
| 5-year | -80.45% |
| YTD | -3.03% |
| 2023 | -37.42% |
| 2022 | -56.35% |
| 2021 | -35.05% |
| 2020 | 139.48% |
| 2019 | -70.70% |
Continue Researching GDOT
Want to do more research on Green Dot Corp's stock and its price? Try the links below:Green Dot Corp (GDOT) Stock Price | Nasdaq
Green Dot Corp (GDOT) Stock Quote, History and News - Yahoo Finance
Green Dot Corp (GDOT) Stock Price and Basic Information | MarketWatch
Loading social stream, please wait...