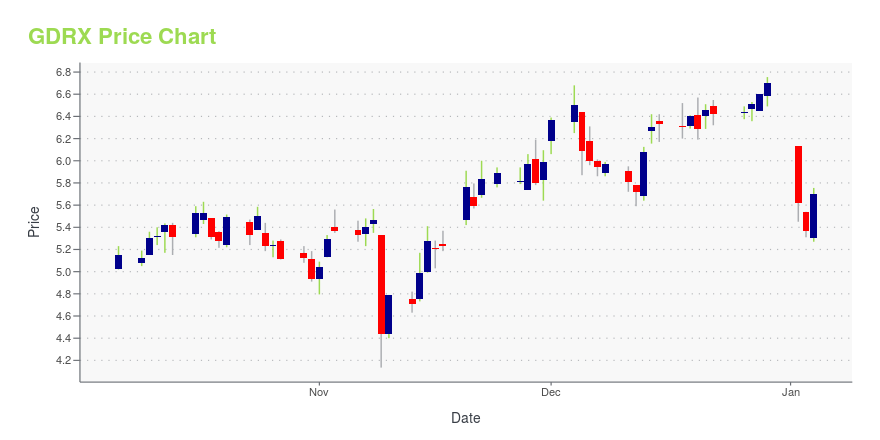
GoodRx Holdings, Inc. (GDRX): Price and Financial Metrics
GDRX Price/Volume Stats
| Current price | $4.43 | 52-week high | $9.26 |
| Prev. close | $4.49 | 52-week low | $3.82 |
| Day low | $4.42 | Volume | 635,902 |
| Day high | $4.66 | Avg. volume | 1,446,670 |
| 50-day MA | $4.65 | Dividend yield | N/A |
| 200-day MA | $5.94 | Market Cap | 1.70B |
GDRX Stock Price Chart Interactive Chart >
GoodRx Holdings, Inc. (GDRX) Company Bio
GoodRx Holdings, Inc. operates a consumer-focused digital healthcare platform. The firm offers information and tools to help consumers compare prices for prescription drugs. It operates applications and websites that provide prices and discounts at local and mail-order pharmacies. The company was founded in September 2015 and is headquartered in Santa Monica, CA.
GDRX Price Returns
| 1-mo | -0.67% |
| 3-mo | 0.23% |
| 6-mo | -35.89% |
| 1-year | -32.06% |
| 3-year | N/A |
| 5-year | N/A |
| YTD | -4.73% |
| 2024 | -30.60% |
| 2023 | 43.78% |
| 2022 | -85.74% |
| 2021 | -18.99% |
| 2020 | N/A |


Loading social stream, please wait...