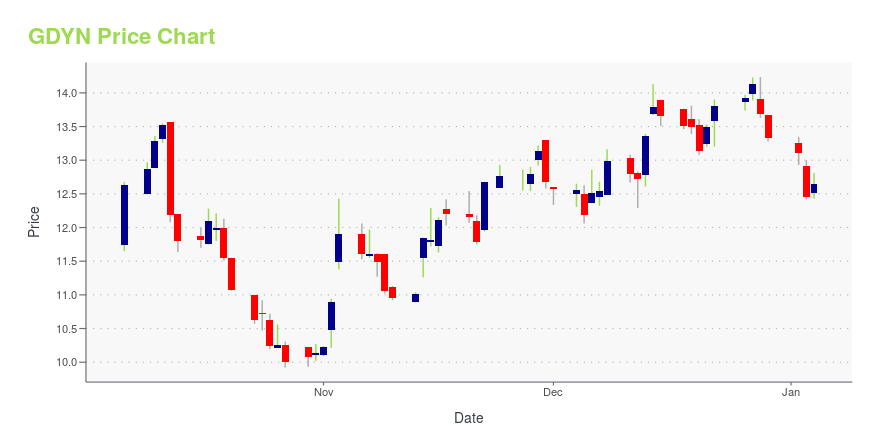
Grid Dynamics Holdings, Inc. (GDYN): Price and Financial Metrics
GDYN Price/Volume Stats
| Current price | $21.06 | 52-week high | $24.16 |
| Prev. close | $20.65 | 52-week low | $9.07 |
| Day low | $20.69 | Volume | 498,600 |
| Day high | $21.13 | Avg. volume | 726,382 |
| 50-day MA | $19.43 | Dividend yield | N/A |
| 200-day MA | $14.02 | Market Cap | 1.74B |
GDYN Stock Price Chart Interactive Chart >
Grid Dynamics Holdings, Inc. (GDYN) Company Bio
Grid Dynamics Holdings, Inc. provides enterprise-level digital transformation services for Fortune 1000 corporations in the United States, and Central and Eastern European countries. It works in collaboration with its clients on digital transformation initiatives that cover strategy consulting, early prototypes, and enterprise-scale delivery of new digital platforms. The company offers focused and complex technical consulting, software design, development, testing, and internet service operations services. It serves customers that operate primarily in the retail, technology and media, and financial services sectors. The company was founded in 2006 and is based in San Ramon, California.
GDYN Price Returns
| 1-mo | 2.73% |
| 3-mo | 36.40% |
| 6-mo | 68.89% |
| 1-year | 63.00% |
| 3-year | -20.68% |
| 5-year | 91.28% |
| YTD | -5.31% |
| 2024 | 66.84% |
| 2023 | 18.81% |
| 2022 | -70.45% |
| 2021 | 201.35% |
| 2020 | 16.13% |


Loading social stream, please wait...