
Great Elm Capital Corporation (GECC): Price and Financial Metrics
GECC Price/Volume Stats
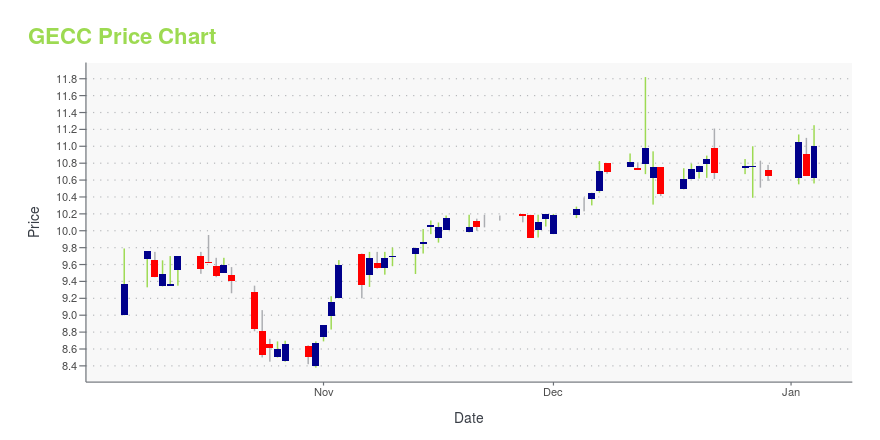
| Current price | $10.83 | 52-week high | $11.82 |
| Prev. close | $10.59 | 52-week low | $8.14 |
| Day low | $10.50 | Volume | 4,253 |
| Day high | $10.83 | Avg. volume | 17,944 |
| 50-day MA | $10.35 | Dividend yield | 12.84% |
| 200-day MA | $10.34 | Market Cap | 102.37M |
GECC Stock Price Chart Interactive Chart >
Great Elm Capital Corporation (GECC) Company Bio
Great Elm Capital Corporation is a business development company which specializes in loan and mezzanine, middle market investments. The fund prefers to invest in media, commercial services and supplies, healthcare, telecommunication services, communications equipment. It typically makes equity investments between $3 million and $10 million in companies with revenues between $3 million and $75 million.
Latest GECC News From Around the Web
Below are the latest news stories about GREAT ELM CAPITAL CORP that investors may wish to consider to help them evaluate GECC as an investment opportunity.
Great Elm Capital Corp. (“GECC”) Declares $0.10 Per Common Share Special Cash DistributionWALTHAM, Mass., Dec. 12, 2023 (GLOBE NEWSWIRE) -- Great Elm Capital Corp. (the “Company” or “GECC”), (NASDAQ: GECC), a business development company, today is pleased to declare a special cash distribution of $0.10 per common share (the “Special Distribution”). The Special Distribution will be payable on January 12, 2024 to stockholders of record as of December 29, 2023. “We are very pleased to be able to deliver a special cash distribution of $0.10 per common share to stockholders,” said Matt Ka |
Great Elm Capital Corp. (“GECC”) Extends Revolving Credit Facility, Lowers Cost of CapitalWALTHAM, Mass., Nov. 27, 2023 (GLOBE NEWSWIRE) -- Great Elm Capital Corp. (the “Company” or “GECC”), (NASDAQ: GECC), a business development company, today announced it has amended its existing $25 million revolving line of credit (the “Revolver”). The amendment provides for a three-year extension of the Revolver’s maturity to May 2027, subject to a springing maturity. In addition, the rate in effect for any future Company borrowings was reduced by 50 basis points to SOFR plus 300 bps, subject to |
Great Elm Group, Inc. (NASDAQ:GEG) Q1 2024 Earnings Call TranscriptGreat Elm Group, Inc. (NASDAQ:GEG) Q1 2024 Earnings Call Transcript November 10, 2023 Operator: Ladies and gentlemen, thank you for standing by. My name is Cheryl, and I’ll be your conference operator today. At this time, I’d like to welcome everyone to the Great Elm Capital Group Earnings Conference Call. All lines have been placed […] |
Great Elm Group Inc Reports Substantial Revenue Growth and Net Income Turnaround in Q1 Fiscal 2024Key Financial Highlights and Management Commentary |
Best Value Stocks to Buy for November 6thGECC, AMAL and TRIP made it to the Zacks Rank #1 (Strong Buy) value stocks list on November 6, 2023. |
GECC Price Returns
| 1-mo | 5.87% |
| 3-mo | 7.81% |
| 6-mo | 5.32% |
| 1-year | 50.98% |
| 3-year | 2.13% |
| 5-year | -46.61% |
| YTD | 8.73% |
| 2023 | 50.81% |
| 2022 | -47.39% |
| 2021 | 12.60% |
| 2020 | -41.03% |
| 2019 | 12.30% |
GECC Dividends
| Ex-Dividend Date | Type | Payout Amount | Change | ||||||
|---|---|---|---|---|---|---|---|---|---|
| Loading, please wait... | |||||||||
Continue Researching GECC
Here are a few links from around the web to help you further your research on Great Elm Capital Corp's stock as an investment opportunity:Great Elm Capital Corp (GECC) Stock Price | Nasdaq
Great Elm Capital Corp (GECC) Stock Quote, History and News - Yahoo Finance
Great Elm Capital Corp (GECC) Stock Price and Basic Information | MarketWatch
Loading social stream, please wait...